Stumbled upon this book while searching for a basic level book on ‘Statistics’ and the blurb and reviews caught my attention so I decided to pick it up.
(How To Lie With Statistics – Darrel Huff)
It’s a petite book with less than 150 pages. It’s not really a book on ‘Statistics’ but on how Statistics are used and abused both consciously and unconsciously by advertisers, surveyors, sales people and others alike or ‘Statisculation’ (Statistical Manipulation)
Here’s a little summary/review of the book:
- Many a times the surveys/findings that we read/hear about are bound to be incorrect because of the bias while collecting samples. Either the sample chosen for doing survey isn’t well defined or doesn’t reflect well on the overall set.
- Averages – Mean/Median/Mode . Choosing an average to depict some statistics is very important and for the layman’s eye it is very easy to draw wrong inference in some cases by mean or average without knowing about the range. Average salary alone for example doesn’t reflect the information correctly so its important to know the range and also the median.
- Missing little figures: Using a very small group to draw a trend, not providing enough information about a particular % in question to even as much as not labeling an axis in a graph. Often one needs to question the completeness of the statistic provided.
- Keep an eye on Probable and Standard errors with measurements in question for ex: IQ of 101 and 98 could just be 101 and 98
- A difference is only a difference if it makes a difference
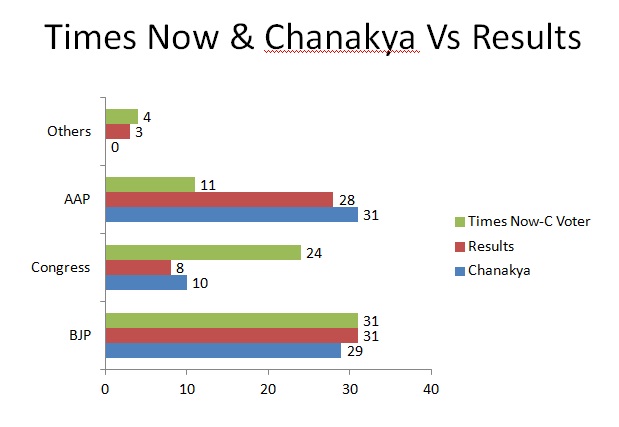
- Graphs can be manipulated in various ways namely cutting the graph from bottom(to reduce the visible area), changing the measures of axis to make the graph looks better or worse
- In charts with more than 1 D, using double the area to show double dimension is misleading. Varying size of objects to show increased number often gives an impression of the change in actual size of object in question over time.
- Semi-attached figures, post hoc and many more
How to talk back to a statistic ?
Ask the following questions
- Who says so ? (To understand biases)
- How does he know? (Source and reliability of information presented
- What’s missing? (Actual numbers in case of %s, base in case of index or other things)
- Did somebody change the subject? (Switch between raw figures and their conclusion)
- Does it make sense? (Apply commonsense on the data, and try extrapolating the trends to check sanity)
A quick read for the initiated which will change how you see statistics used around and hopefully save you from deriving false conclusions