The concept of conversion funnel is quite old and surprisingly still not as widely used/referred to. Be it an e-commerce website or a social network, there are two, rather three aspects of workflow and analytics
- Getting customers – Acquisition
- Getting them to do “something” – Conversion
- Getting them do “something” again and again – Retention
For e-commerce sites aka pipes the conversion is applicable for customers only, while for social networks and other sites aka platforms where value is created and consumed by two parties we have to keep in mind conversion for both of them to be able to achieve the end goal.
Let’s consider a job portal and see what the conversion funnel for it will look like.
- Visit to home page
- Visit to job category page
- Visit to job listing page
- Apply to job
Note: All these steps don’t necessarily need to be followed in the same order. For ex: A visitor can land directly at a job listing page via Google search
The above mentioned four points are the simplest way to accomplish task of applying for a job but there could be a lot of other variants which though complex/indirect but would still reach to same goal. For instance instead of clicking on a job category page link the user does a search and goes to search listing page. One way to look at such alternate paths is to create a funnel for each one of them
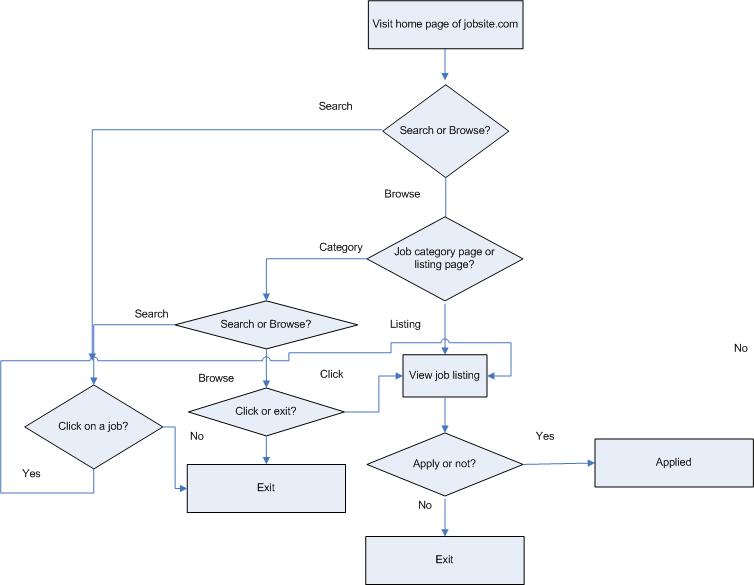
These are some of the possible routes (for ex: some visitors would neither search or browse and just exist from home page itself). In best case scenario you should know precisely the split of people who searched, browsed and existed. Further, you should create separate funnels or each search and browse loops.
Let’s say the home page had 100 visitors. Searched = 30, Browsed = 55, Exits = 15
The conversion funnel for search would look like
Visits (100) -> Search (30) -> View job listings(10) -> Apply(2)
The conversion funnel for browse would look like
Visits (100) -> Browse(55)
1) -> View job category page (15) -> View job listings(10) -> Apply(3)
2) -> View job listings(40) -> Apply(5)
By considering the drop off at each stage you would be able to pin point the problem. For instance if only 1/3rd people are clicking to view job listings after search, maybe the search isn’t that efficient and needs to be worked upon. You could further zoom into this by dividing all searches into two categories.
- Searches for which some results were shown (20)
- Searches for which no results were shown (10)
In the above example only 20 searches had results against them, which means the click through rate for search is 50% and not 33% as perceived earlier. Now could consider improving this rate and on the side figure out how to reduce the cases in which no search results were shown.
Similarly from View listing to Apply. You can break this task into the below mentioned to be able to see the exact stage of drop off
View job listing -> Click Apply Button -> Login/Signup -> Apply
I’d end this post by stating that, you should try to use the workflows/flowcharts to identify various stages of a user goal and then analyze data across them to be able to identify the issues and fix them
To be continued…

