Continuing last editions list of most read articles. Sharing Top 15 Most Read Articles of 2019 read on my weekly newsletter “Best of the Web”.
Most Read Articles: 15) PG’s awesome essay on ‘What makes a genius’ 14) How can a non-tech guy become the go-to advisor to some of the world’s most powerful tech companies? Great profile of a fascinating person, Bill Campbell – The Secret Coach. 13) The Gross Margin Problem: Lessons for Tech-Enabled Startups. Read here 12) Hanlon’s Razor (and why people are nicer than you think). Read here. 11) How India’s Growth Bubble Fizzled Out. Read here 10) Morgan Housel’s post, ‘Betting on things that never change‘ 9) Beautiful essay by Paul Graham on what it means to have kids. Read here 8) A light breezy read on “Rich People’s Problems”. Read here 7) How to build optionality into your life. Read here 6) Peter Thiel’s Contrarian Strategy. Read here 5) Capital ROI of various Indian Startups. Read here 4) Tiny networking tip by Ben Horowitz. Read ‘Strike when the Iron is hot‘ 3) Paul Graham’s classic 2004 essay, ‘How to make Wealth‘ 2) Maria Montessori and 10 famous graduates from her schools. Read here 1) My new goal in life is to avoid a mid-life crisis. Read here
While its counterparts (FB, Instagram etc) have been able to ride the growth waves to the fullest, the ride for Twitter hasn’t been exactly a breeze.
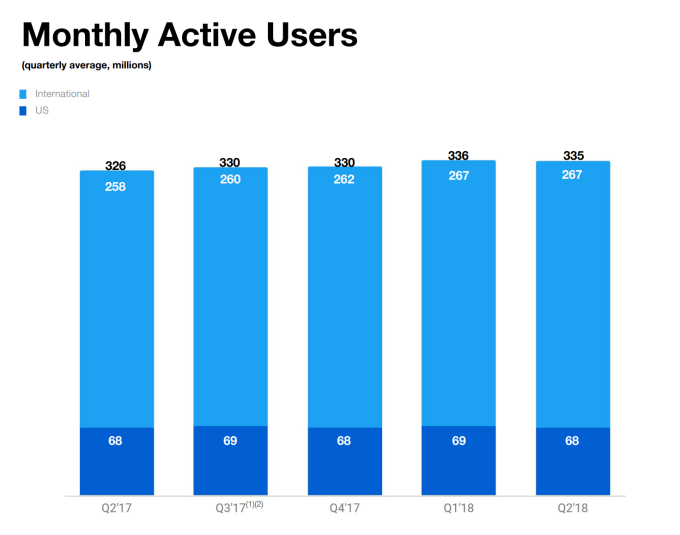
Flat Growth in Twitter’s MAU
As visible from the image above, Twitter’s Net New Active User Growth (New Active Users – Lost Users) was “-One Million MAUs”. Amidst, the fake account cleaning activity underway, the company expects this -ve growth trend in MAU to continue and the MAUs to drop further by ‘mid-single-digit millions’ in the next quarter.
While the MAU growth has been rather Flatish, the DAUs and Revenue numbers show some signs of growth
People are using Twitter more often
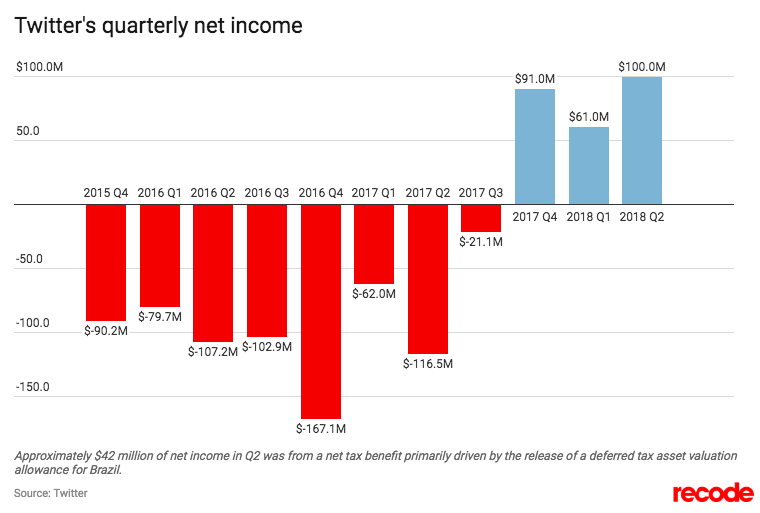
Twitter is making some money
For now Twitter claims to be prioritising ‘Health’ over ‘Growth’ by undergoing a massive cleanup (Apparently, the company’s health problem also costed them an acquisition offer from Disney).
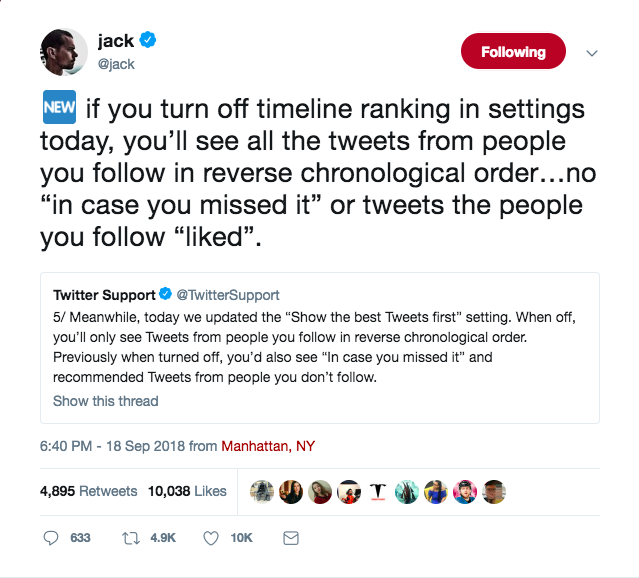
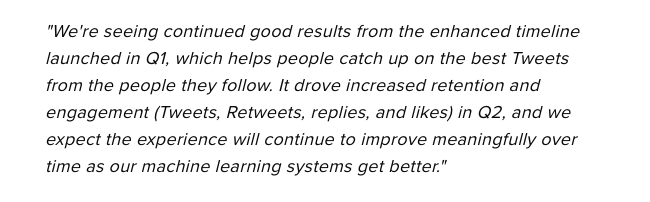
However, in middle of all this Jack Dorsey announced last week a new functionality, the ability to change the user feed aka timeline.
Jack’s announcement about changes to timeline
A lot of Power users felt a collective sigh of relief. A few features have been on the wish list of a lot of users namely
Abuse control (Stopping accounts that spread hate/harass others, bots)
Ability to Edit a Tweet
Reverse Chronological Timeline (Raw user feed)
Not sure about others, but I found this update rather interesting. Though I initially (and to some extent later) felt how the Twitter timeline experience had sorta deteriorated, but it never bothered me that much.
In fact, I think for most people the value Twitter provides in terms of ‘staying in the know’ (along with one’s network) is much more than any bad changes to timeline.
A quick look at Twitter’s Timeline/User feed
Starting 2015 (Jack’s Return), Twitter started making changes to the user timeline to offer a better experience (and better monetisation?). Prior to this the timeline was simply in reverse chronological order.
The Twitter Algo (pre-recent changes) via Buffer
‘Ranked Tweets’ are tweets recommended for each user by Twitter’s algo on the basis of
How Twitter’s Algo works
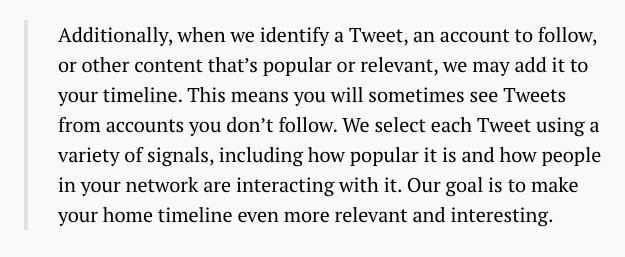
Apart from ‘Ranked Tweets’ and ‘In Case You Missed It’, Twitter also started ‘Seeding Tweets by accounts they don’t follow’ into users timeline
While this last move definitely annoyed a lot of users from both timeline intrusive and also their own privacy POV, it apparently worked wonderfully well for Twitter.
As for me, I was finding more interesting tweets and new people to follow due to the ‘A, B and C liked this’ feature. I remember stumbling upon new content and users regularly and thus ended up interacting with that content and also following up more people.
It’s been a week since I reverted back to original timeline, while there is no meaningful difference in the quality of my timeline, the discoverability of new content/people have definitely gone down. I don’t remember starting to follow anyone in the last week or so.
Twitter for as long as I can remember has had a concentration of power users.
Median Twitter User has only 1 follower, as compared to Median FB User that has 100 friends
As Felix Salmon writes in Wired, “Twitter is becoming increasingly concentrated on a tiny core of power users. It’s less and less a distributed mode of many-to-many communication, and more and more a broadcasting hub for the elite—a highly unequal place where their least-considered, Ambien-addled opinions get amplified to a global audience of millions.”
Power users are at core of every product and one must count them lucky to have lots of them, however defining your product roadmap on the basis of what power users want isn’t necessarily the best thing. Given the tricky spot in which Twitter finds itself in (chasing profits via monetising eyeballs and keeping power users happy) they have to make changes to the product that makes their revenue targets met without compromising the user experience much and without bloating the product with hundreds of settings.
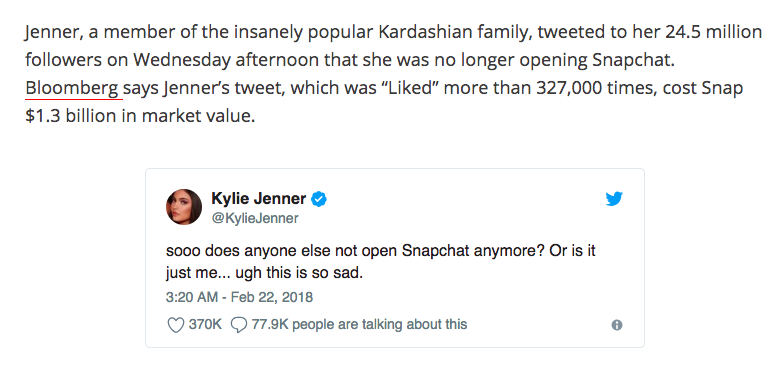
PS: Snapchat is another example of challenges a company faces on being the other side of Power User dynamics.
I often come across folks who are getting started with their startups. Many of them are looking for advice and their is one question that almost everyone of them asks without fail.
How can we scale up marketing for our startup?
Make Stuff That People Want
It’s like they’ve figured out everything else and the only thing that is to be solved for now is Growth. First time founders are particularly prone to this line of thinking.Typically in most such cases, there are a few things that seem to be working.
Some Traction
The site is getting a bit of traffic or their app is getting a few downloads.
A few users are signing up or leads are being generated.
There are a few active users.
Some revenue or repeat usage of the product.
To the founder’s credit, they’ve built a product and figured out some stuff in getting their product in front of the potential users. However, more often than not they end up jumping the gun in thinking that all the basic groundwork is done and all that remains is reaching to more people.
But incidentally, there’s more to it than meets the ‘optimistic founders’ eye. Let’s dig a little deeper.
A startup’s life comprises of multiple stages that need to be sequentially navigated.
Two Major Phases in a Startup’s Life
Pre Product-Market Fit (Pre-PMF)
Post Product-Market Fit (Post-PMF)
Understanding Product-Market Fit
In layman’s terms, achieving Product-Market Fit means
You’ve figured out a way to solve a problem that enough users care enough about (to pay enough for).
This definition covers three core aspects important to any startup
Market — You might solve a problem for a handful users but are there ‘enough users’ that feel the pain/need for a solution?
Product — You might have come up with a solution but does it ‘really resonate’ with your users?
Monetisation — Your users might be using your product to solve a problem but are they willing to ‘pay reasonably’ for it(or is their a different way to monetise like Ads and such)?
While the above mentioned might seem obvious, I’ve seen more entrepreneurs mistake confusing getting a Pre-PMF with a Post-PMF (You might want to re-read the points in quotes above).
Amidst all the buzz around fundraising, press-coverage and exists, the urge to ‘grow fast and kill it’ is understandable. However, before worrying too much about the non-existent growth you absolutely need to understand if you’ve found a product-market fit.
Important: A vastly important point here as I’ve learned over the years is that Market > Product. “Which market to operate in” could be a great heuristic to work with. More on that in a later post.
Why is Product-Market Fit Important?
Product-Market Fit is the Holy Grail of Startups
Nothing kills a bad product faster than good marketing
Premature Scaling or spending effort and money on marketing a half-baked product to solve a half-thought through problem is potentially dangerous.
It requires a significantly harder push to market a product that claims to solve a problem most users don’t realise enough(they have) in a way that doesn’t make sense to them. By resolving to spray and pray marketing you might acquire some users, a few of which might translate into paying customers but more importantly, it will give you an illusion that you’ve figured out what people want.
It’s this precise illusion that’s the biggest problem. Most people who find themselves in this illusion end up adding more features into their product, continue their spray and pray efforts to acquire users, trying to raise funds and more often than not reach the woeful end of “Running out of money”.
Contrast this with a situation in which you’ve found Product-Market Fit. In which case, every single step mentioned above will seem like a breeze (ok, almost like a breeze).
Also, it’s worth noting that one important and often overlooked factor that seems to add up to the illusion of figuring out PMF is the founders psychology. While things begin with a sound footing, many a times the empathy to truly solve a customers problem and delivering a wow experience is quietly taken over by a personal insecurity and need for validation. Once in this zone, the founders tend to look and even gloat in any metric that confirms their illusion. So, being self-aware about your psychology is a must for course-correction.
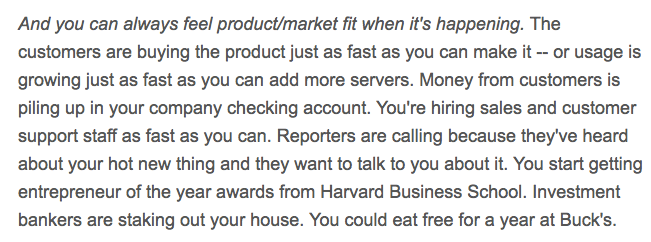
What does Product-Market Fit look like?
Marc Andreessen on what PMF Looks Like
In essence,
Having a product-market fit means it’s much easier to convert users and retain them
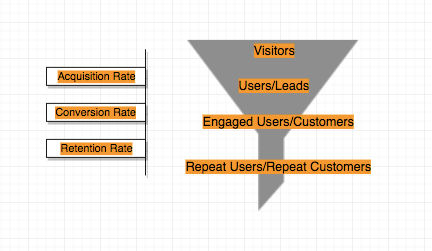
Let’s refer to the user funnel to find more. Here’s what a typical user funnel for B2C/B2B startup looks like
User Funnel
Whether you have found a product-market fit drills down to two metrics really
Conversion Rate — (No of engaged users/No of users) or (No of customers/No of leads)
Retention Rate — (No of repeat users /No of engaged users) or (No of customers/No of repeat customers)
And out of these two also, I’d prioritise Retention over Conversion as it’s a definite indicator of PMF
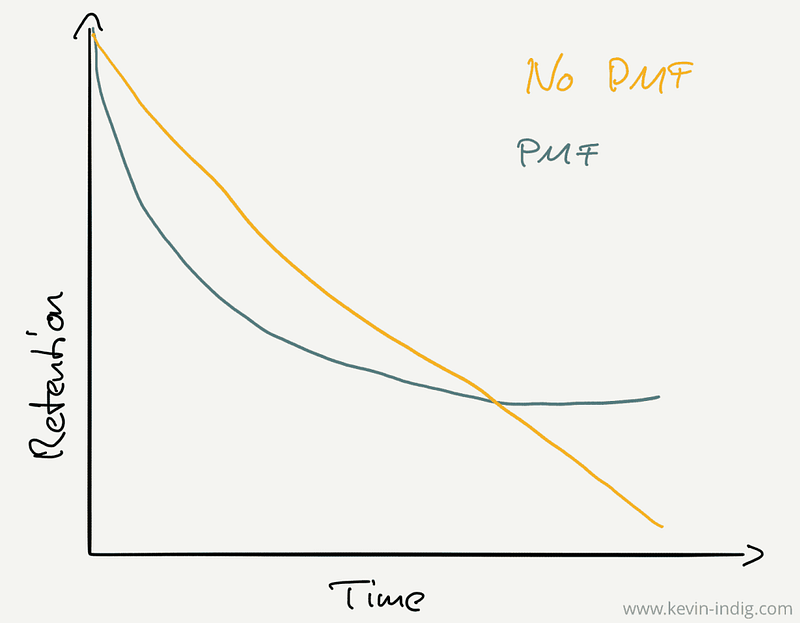
Retention vs PMF
If these two metric are reasonably good, chances are you have attained PMF and can now focus on scaling growth. On the other hand, if these two metrics, especially the Retention Rate are in single or early double digits there’s a problem. It’s likely that you are yet to find a PMF and you need to go back to the drawing board and figure that out.
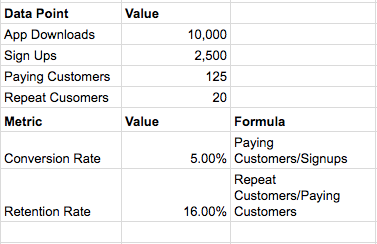
Let’s take an example of an app that lets you improve your health by connecting with you a nutritionists or fitness coaches. To check the PMF status we will have to look at the user funnel numbers.
Sample Funnel Data for a Health App
As visible from the data above, it looks like a case of Pre-PMF as both conversion rate and retention rate are weak, therefore they are better of trying to first find a PMF and then worry about growth.
PMF Discovery Tip: Go through your user data and see if there’s some segment of users that has significantly higher retention than others. This just might be the niche for which your offering makes perfect sense. Next, you can double down on sharpening your offerings further for them and then get to finding more such people
I’d like to conclude by saying that at an early state of your startup while you must continue to feed top of your funnel by acquiring some users (more data to analyse the better) but don’t be too eager to press the gas pedal on marketing or growth till you’ve figured out a set of users (around 100 for a B2C business) that truly love what you are doing.
Till the time you’ve found out those users, improve your product offering or consider targeting a smaller niche with your existing product.
Thanks to Sameer Guglani, Navneet Singh, Monica Jasuja, Aditya Sahay and Lakshay Pandey for their feedback.
This is second part in a series of posts on ecommerce customer lifecycle management. In the first part we discussed an overview of CLM and in this post we’ll discuss how to identify, measure relevant customer lifecycle metrics and define goals to improve them.
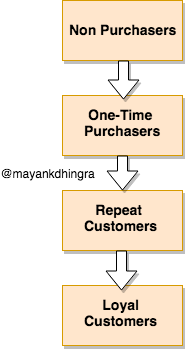
Basic E-commerce Customer Lifecycle.
Pic 1: E-commerce Customer Lifecycle (Basic)
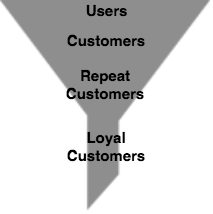
To improve progression of users through the lifecycle we will look at the corresponding funnel as funnels are great to measure stage wise conversion
Pic 2: Customer Funnel (Basic)
Quick Definitions
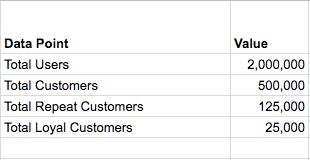
Total Users: Users with email id/phone number/apn or gcm id.
Total Customers: Users that have ordered at least once.
Total Repeat Customers: Customers that have ordered more than once.
Total Loyal Customers: Customers that have ordered more than Z times.
We’ve mapped the lifecycle into these four basic funnel stages because they represent a user action based milestone. This grouping of users is important because users in each stage share a lot of similarities in their experiences(or lack of) with the product and the kind of nudges required to help them move to the next stage.
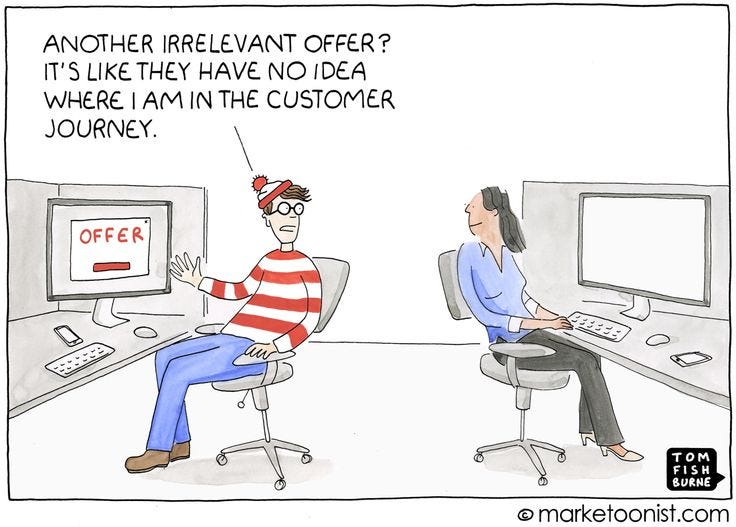
Spray and Pray is not a Strategy
A mistake most marketers tend to make is to send the same communication to all users. It’s wrong to assume that the same communication will work for both ‘Non Purchasers’ and ‘Repeat Customers’.
Identifying Key Customer Lifecycle Metrics
The key metrics to be used have to be leading (or input) metrics i.e they are influenceable or directly actionable. In this case, the relevant metrics are the conversion rates from one stage to another. Let’s take some sample data
Pic 3: Overview of Customer Funnel
At a high level, this table above tells you all there is know about the business and the levers to improve things are the conversion rates that correspond to each stage.
Retention is poorly understood
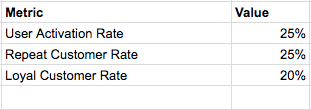
Key CLM Metrics aka E-commerce Vitals:
Pic 4: Key CLM Metrics
User Activation Rate
= (Total Customers /Total Users) * 100
These Key CLM Metrics are E-commerce equivalent to the human body vitals.
As a growth guy, I lay extreme emphasis on these CLM metrics because they help me understand the current state of things and point towards directions that need the most work.
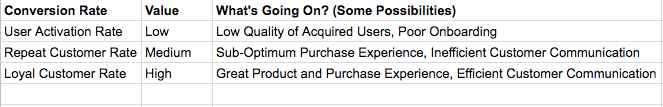
Pic 5: Each Metric Tells A Story and Suggests A Direction to Work On
With these three metrics identified, the task ahead is clear
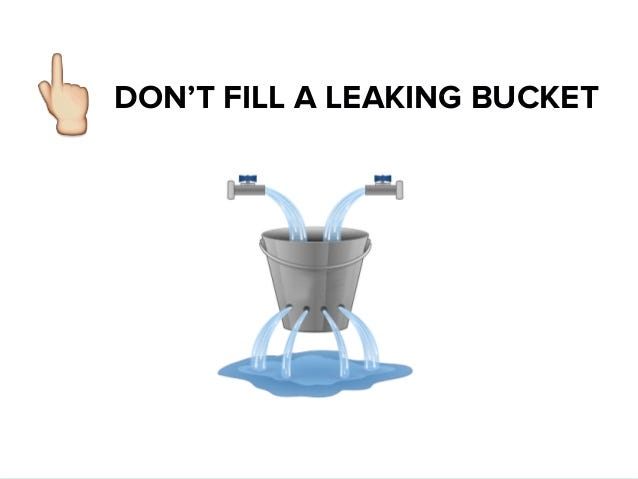
Customer acquisition is just half the battle won.
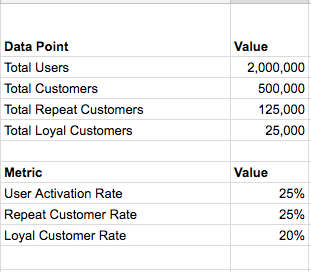
Pic 6: Overview of Customer Data and Key Metrics
There can be 3 broad goals for improvement from here
Increase User Activation Rate (Biggest Improvement Area) — An improvement by 5% here will translate into 20% increase across Customers, Repeat Customers and Loyal Customers
Pic 7: User Activation Rate — The biggest lever of retention
Since User Activation Rate impacts the top of the customer funnel and a small improvement here will have the maximum impact in both customer count and revenue, it is paramount to improve it ASAP.
It’s important to fix User Activation Rate at the earliest
2. Increase Repeat Customer Rate (Toughest Improvement Area) — This is the second biggest improvement area. An improvement by 5% here will translate into 20% increase in both Repeat & Loyal Customers
Pic 8: Repeat Customer Rate — The second lever of retention
If there are a lot of folks who are placing orders but aren’t coming back to buy again this could be a serious problem. This metric needs to be looked from multiple perspectives — Product Quality, Post Purchase Experience, Post Purchase Communication and such.
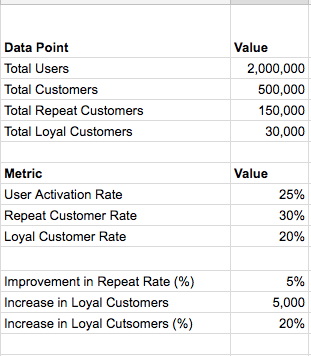
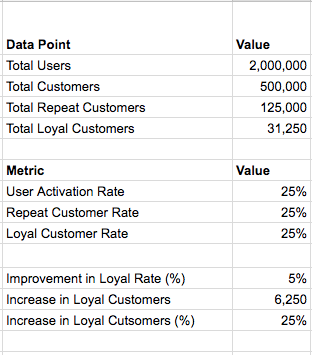
3. Increase Loyal Customer Rate (Easiest Improvement Area) — An improvement by 5% here will translate into 25% increase in Loyal Customers.
Pic 9: Loyal Customer Rate — The third lever of retention
In my experience I’ve found this metric easier to influence than the repeat rate. Customers that have made multiple purchases are comparatively easier to retain & re-activate. You also have the most behavioural data about them.
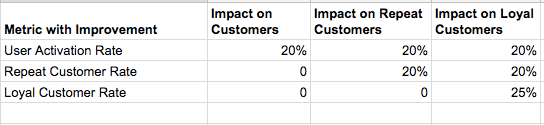
Here’s a quick summary showing the impact of a 5% improvement in each key metric on One Time Purchasers, Repeat Customers and Loyal Customers.
Pic 10: Impact of a 5% improvement in each metric on Customers, Repeat Customers & Loyal Customers
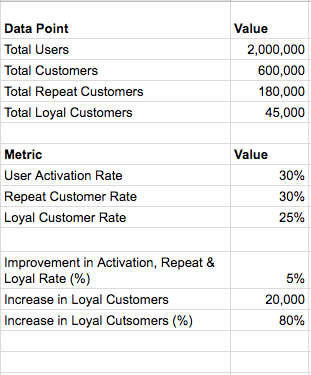
The table above summarises the impact pretty neatly. In case, this is looking exciting, let me add to the excitement by showing you the improved numbers in a case where you are able to increase each key CLM metric by just 5%.
Pic 11: Impact of 5% improvement across all three Key CLM metrics
Not only the % of people in each lifecycle stage looks quite better, the increase in loyal customers by 80% is fantastic
With these three broad CLM goals defined and projections explored, we have a task cut out for the marketing/growth team to make plans around.
In this post we’ve focused on identifying the Key CLM Metrics and Defining CLM Goals. In the next post in this series we’ll discuss some strategies to achieve these goals.
If this is the first post you are reading in this series, there’s a prequel to this post on introduction to Ecommerce Customer Lifecycle Management here
Thanks Navneet Singh and Saurabh Tuteja for their feedback
This is the first part of a series of posts on e-commerce customer lifecycle management. In this post we’ll discuss an overview of CLM (The What & Why) and it should be useful for a marketing/growth person in designing their CLM strategy
A few things to note:
Analysing data only makes sense once you have a sizeable amount of it.
In this post we are only covering user and customer engagement.We will cover visitor data in a separate post
For sake of simplicity in this post we are only looking at linear movement across different lifecycle stages.
There are a lot of lenses to look at e-commerce customer behaviour data from but Customer Lifecycle Management(CLM) is at the core of it all. I believe CLM is the fundamental element that needs to be in place for you to drive good ROI on your marketing or growth efforts. Once you have a defined CLM framework, you can start focusing on other aspects. Let’s dig a little deeper
What is Customer Lifecycle Management? Customer lifecycle is a term used to describe the progression of steps a customer goes through when considering, purchasing, using, and maintaining loyalty to a product or service.
Customer Lifecycle Management (CLM) is a framework to facilitate a smooth movement of users(non-purchasers) from acquisition towards loyalty (repeat active customers) by maximising the value delivered at each customer engagement touchpoint and removing all friction in conversion
Pic 1: E-Commerce users’ Journeys
Why is it important to manage Customer’s Lifecycle?
With limited customer acquisition channels, the customer acquisition costs will continue to rise unabated
It is much easier to convert and retain an existing customer than to acquire a new one
A happy customer will not only purchase more, they will also spread the word for you and bring additional customers.
Or put it other way,
“You can’t build a sustainable e-commerce business without repeat customers”
The Scope of Customer Lifecycle Management
Let’s briefly discuss what all does a CLM framework entail. We can divide the scope of work for CLM into the following
Defining lifecycle stages, identifying relevant metrics and data
Conceptualising categories of customer communication to nudge users from one lifecycle stage to the next
Designing campaigns and creating content for categories defined above
Executing various CLM campaigns and iterating on them to improve their efficacy.
Designing The Customer Lifecycle
While there’s no standard way to define a customer lifecycle for an e-commerce/transactional business, in my experience I’ve found this flow to do the job well.
Pic 2: Customer Lifecycle (Basic)
This basic version of customer lifecycle is useful to get a high level overview and is easy to get started with.
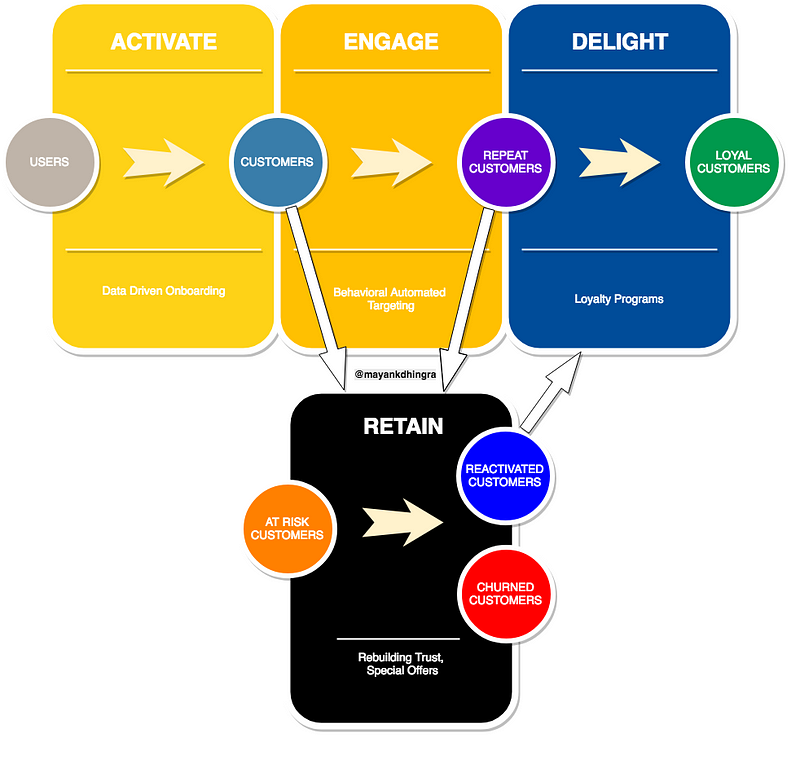
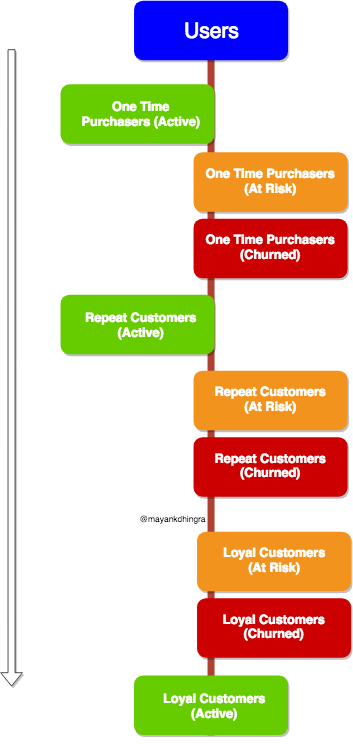
Pic 3: Customer Lifecycle (Advanced)
For the mature growth/marketing person, this advanced version of lifecycle will be beneficial. The advanced lifecycle is particularly beneficial for mid to large sized businesses.
I find this representation useful because it gives a more in-depth view of what exactly is happening in each lifecycle stage (Pic1). Also, by splitting various lifecycle stages by their purchase activity you get a better sense of how many customers are active, at risk of getting churned and have already churned.
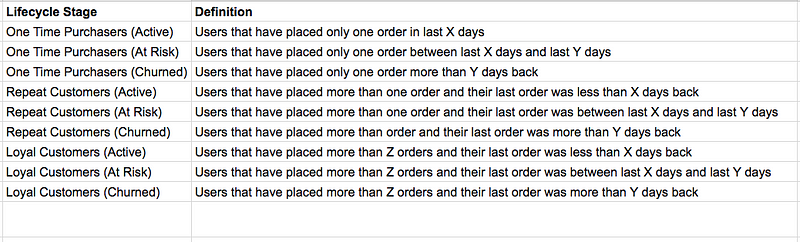
Defining Lifecycle Stages Before we jump to the metric, let’s quickly understand what each stage means.
Pic 4: Definition of Various Lifecycle Stages
In this content, a couple key definitions one must understand are
Risk Window — Number of days for which if a customer doesn’t purchase they are at risk of churning (X days).
Churn Window — Number of days for which if a customer doesn’t purchase they are churned (Y days).
A churned customer is one who hasn’t purchased for long enough that we can consider them to be lost.
Repeat and Loyal Customers There isn’t a definite way to define repeat and loyal customers. For sake of simplicity, I’ve defined repeat customer as anyone who has placed more than one order. Similarly, Loyal customers can be defined in multiple ways (orders/revenue etc) but I’ve defined them on the basis of number of orders (Z orders).
Depending on the nature of business, you can decide values for X,Y and Z
With the Customer Lifecycle in place, we now have to define our goals and make plans to achieve them. We’ll cover those in the remaining parts of the series.
Update: You can view the part two of the series in which we cover CLM Metrics and Goals here
Thanks Navneet Singh & Nitish Varma for reading the drafts.