Category Archives: e-commerce

Content, Community, Commerce and all that Jazz

Over the course of years, lots of startups have tried to leverage their content/community to sell stuff to users but have seen limited success. So much so that one has to try really hard to find some examples of  content or community platforms across the world that have managed the crossover at a reasonable scale.


Can you name a startup (content or community) that is able to successfully sell stuff at a reasonable scale to their users?

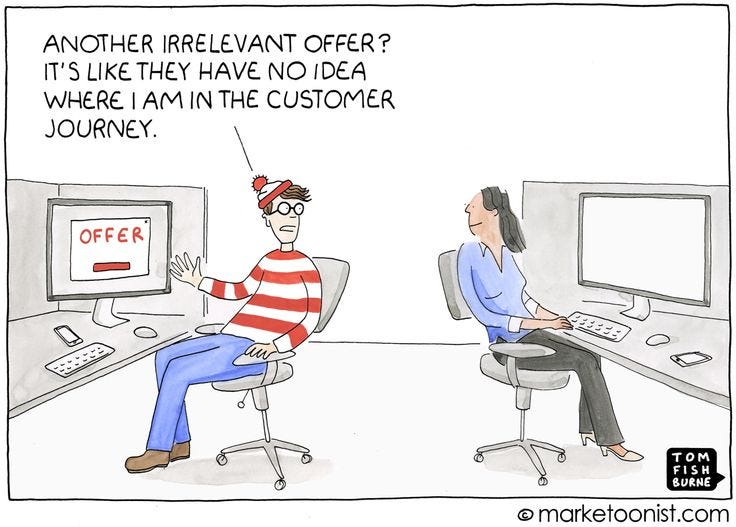
Just so we are clear, here by commerce I mean transactions (visitors/user of a content or community platform buying stuff on the platform itself). While monetisation via ads and as affiliates have been proven models for long, commerce has been successful in rare exceptional cases. Through the course of a series of posts I’ll try to explore why some platforms could get the commerce play working while others languished.

The Trifecta

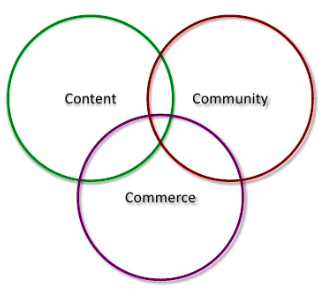
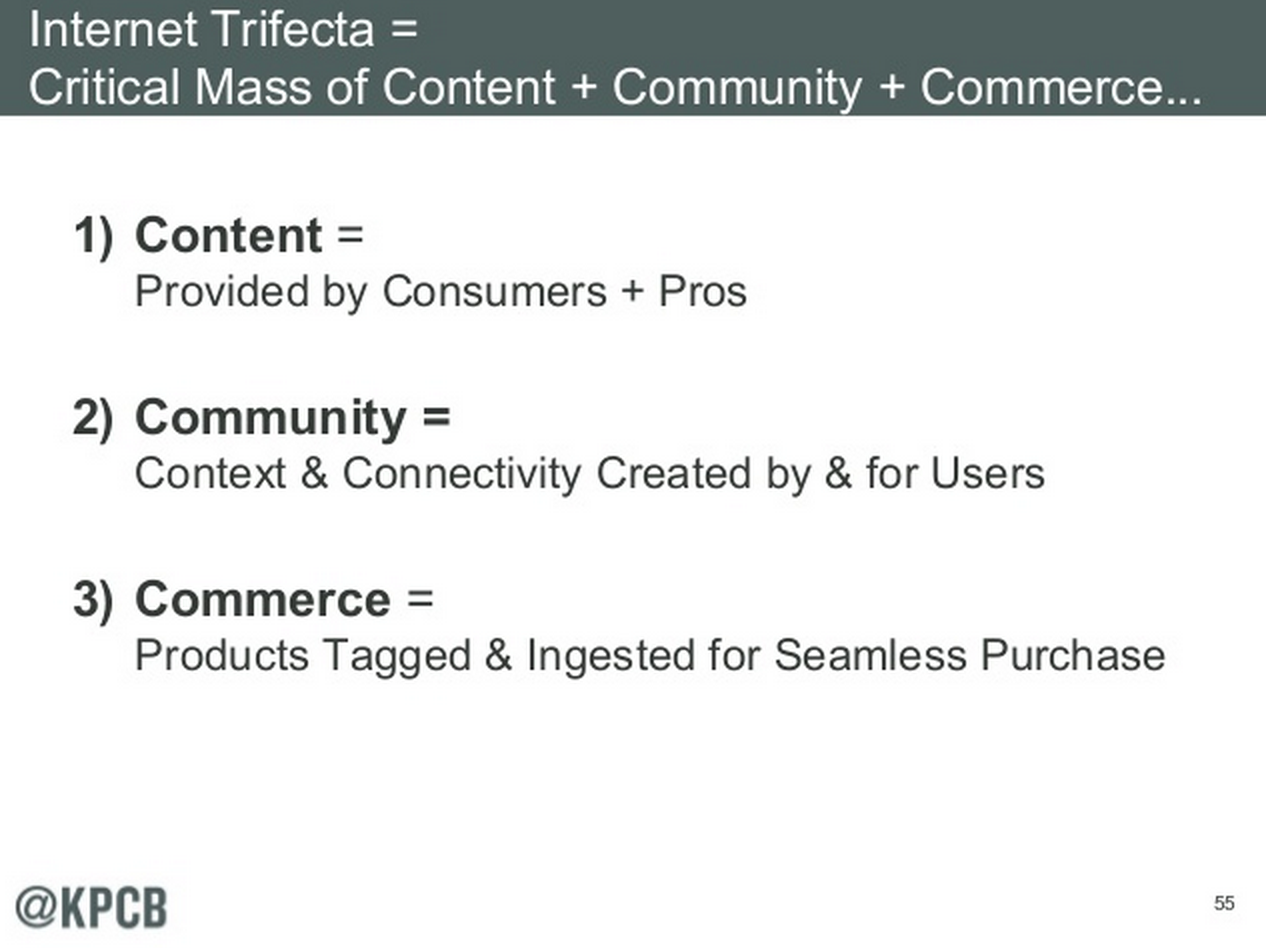
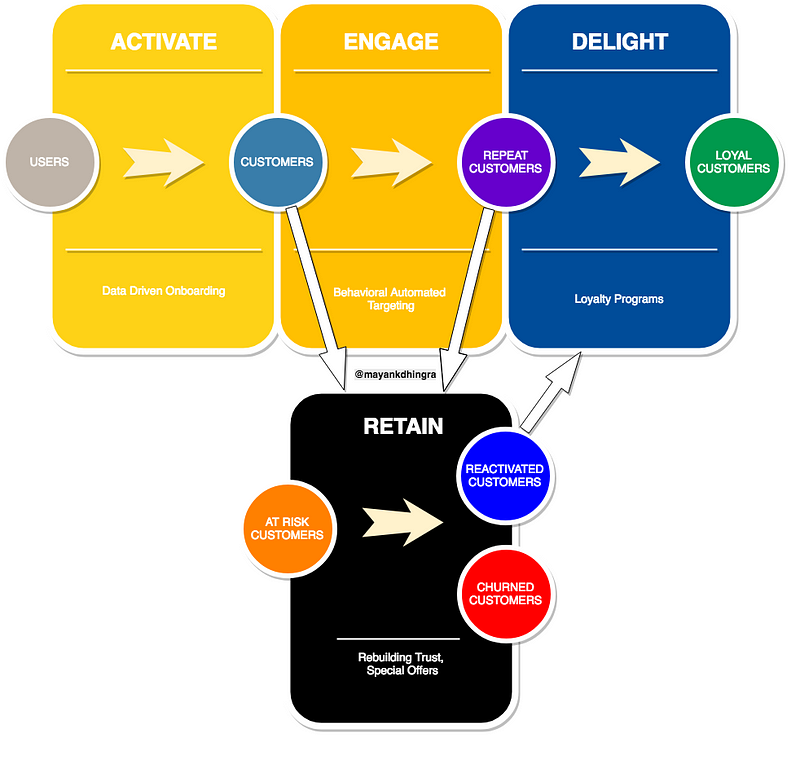
What exactly are the 3Cs:

This slide from a ‘Mary Meeker Internet Report’ gives a good summary of The 3Cs

The Three Cs go long back in Time

The Three Cs are probably as old as Web 1.0
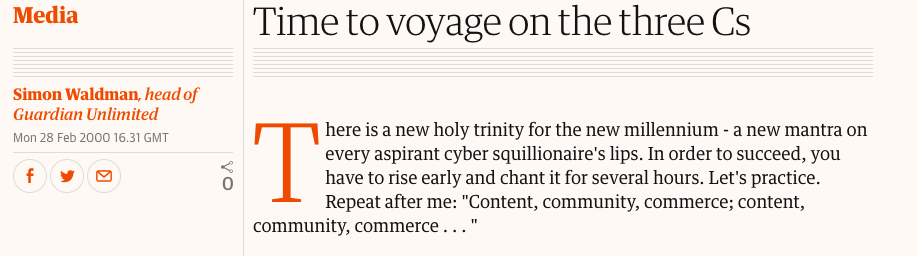
(Pic: An article published in Guardian in 2000 about 3Cs)


How to Think about 3Cs

If you think about it, there are two broad ways for the 3Cs to come together.

  1. Content/Community Platforms adds Commerce (Houzz, Polyvore)
  2. Commerce Platforms adds Content/Community (Amazon, StitchFix)

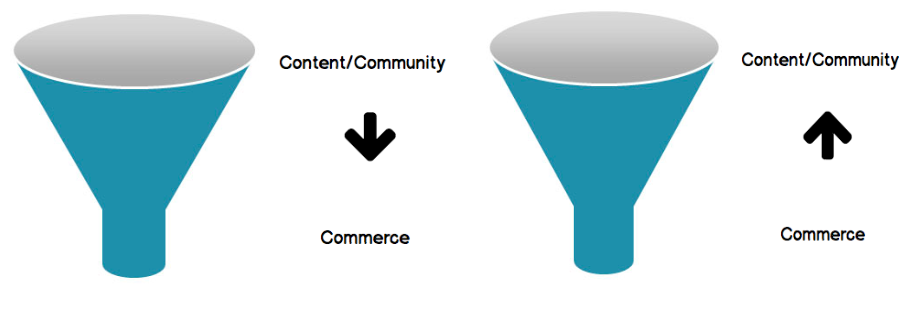
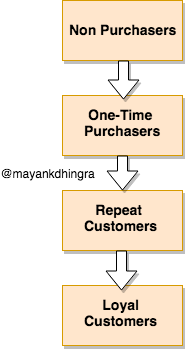
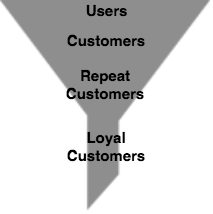
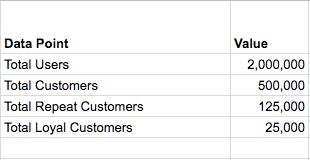
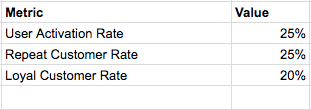
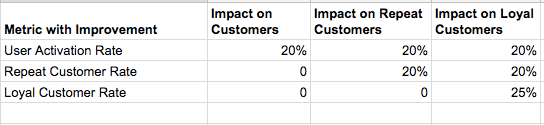
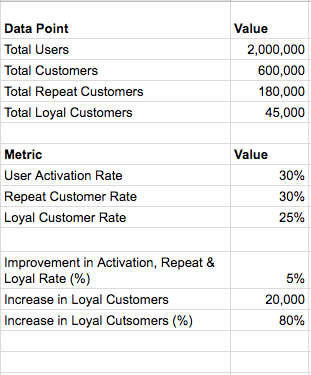
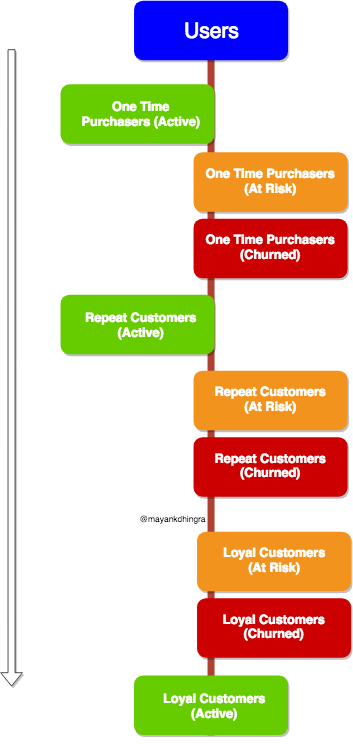
One way to look at Content and/or Community to commerce journey is like a funnel. Content/Community in that case will be Top of the funnel (TOFU) and Commerce, the final transaction will be Bottom of the funnel (BOFU).

That is, more people will engage with the content and/or community (TOFU) and some of them will end up purchasing goods aka commerce (BOFU).

Case 1: Content/Community Platforms adding Commerce
Case 2: Commerce Platforms adding Content/Community

Majority of popular consumer startups fall in two quadrants (Started as Commerce or Started as Content/Community). It is difficult to recall any startups that had both Content/Community and Commerce play from start.

Starting Points for Some Popular Startups

Empirically speaking, it looks like the journey from Commerce to Content/Community (Case 2) is well within the reach. Amazon has been doing it for ages in multiple ways (UGC and Content Acquisitions), in India I think Nykaa is doing a reasonable job. If one spends more time I’m confident a lot of successful examples of this category will come out.

However, the journey from Content/Community to Commerce (Case 1) seems extremely arduous with only a handful successes.

Challenges in Leveraging a Content/Community Platform for Commerce

  1. Low Captive User Base: Most users of content platforms are actually non logged-in visitors (Organic/Social Traffic over Direct Traffic). How will you monetise a user base that isn’t regular/loyal.
  2.  Positioning: While it’s much easier to trust a content/community platform, when it comes to making purchases, the bar is fairly high. People prefer to go to experts. Who would you trust to deliver your order without any nonsense, Amazon or some upcoming content/community site?. Increasingly the mindshare in various commerce categories is already taken (Think Amazon, Swiggy, Zomato, Goibibo, Bookmyshow, Paytm, Myntra). Given the low switching cost on Internet, this challenge is particularly hard to cross.
  3. Expertise: E-commerce, however easy it might appear from outside requires significant operational expertise. Most folks continue to underestimate it, resulting in bad user experience and dissatisfied users that will never buy from you again. Since people underestimate what goes in getting e-commerce experience right, they are perennially underinvested (also, in most cases it is structurally difficult for a content company to invest a lot of resources in such endeavours). Lastly, in each category you are competing with the best in the game (product and/or resources wise)
  4. User Experience (for commerce): This one is particularly true for hosted community platforms. Imagine a community of food lovers, sports lovers on Facebook/Whatsapp etc. As mentioned in #1, the users in such cases are captive to the platform in question not to your group and to make things worse at one end, the platform experience doesn’t facilitate smooth e-commerce (Imagine buying something from a FB/WA group) and on the end hand, you can’t possibly migrate these users to your own site/app which might have a better commerce experience.

Because of the reasons mentioned above I believe it is extremely tough to upgrade from content/community to commerce. I’ll also go to the extent of saying in most cases the platforms in question are better of monetising via traditional channels ads, affiliates, events etc than to start their own e-commerce. 

As of the exceptions to the rule like Houzz, we’ll try to figure out what makes them tick in the next post in this series. 

Flipkart Plus: Customer Loyalty Program by Flipkart

Flipkart, the country’s biggest e-commerce company announced the launch of their loyalty program or customer benefits program (as they are calling it) on India’s Independence Day .

Launch Emailer

Here’s a quick summary of the program

  1. Opt-in membership with zero fee
  2. Free Expedited Shipping
  3. Exclusive access to promotional offers on Flipkart
  4. Reward points (coins) for purchases on Flipkart, which can be redeemed to buy offers on & off Flipkart (other vendors like Bookmyshow, Cafe Coffee Day)
  5. Superior & Priority Customer Support
Membership is just a click away

Flipkart Plus Landing Page

For an e-commerce company to become a sustainable business at scale, customer loyalty (aka retention) is a must. With increased competition and massive customer base, retention is the most obvious and un-avoidable path for all sizeable e-commerce companies, thus the recent public push towards launching loyalty programs.

Coming back to Flipkart, Flipkart Plus is their second attempt to launch a loyalty program. The first attempt was made in 2014.

Flipkart First (Launched in 2014)

‘Flipkart First’, ran for 2-3 years before the company quietly setting the sun on it. Since I was an active customer back then, I purchased ‘Flipkart First’ membership twice to avail the benefits. 

Here’s a quick overview of how the two programs compare with each other

Flipkart First Vs Flipkart Plus

Summarising the key changes:

1. Waving off Membership Fee 
2. No commitment over delivery time and charges
3. Adding early access to exclusive deals
4. Superior and Priority customer service
5. Introducing 3rd part offers and reward points

Let’s try to quickly unpack these changes

  1. Free Memberships:
    Positives — Increased Uptake
    Negatives — No additional revenue from membership fee

    IMO a loyalty program without membership fee is not reflective of brand power and will always restrict goodness you can provide.

  2. Free and Expedited Delivery:
    Positives — Increase in both order count (significant) and revenue (insignificant)
    Negatives — Extra shippings costs.

    Since membership is free and so is shipping, essentially users have no incentive to consolidate their orders and thus they can & will choose to place standalone order for low ticket items but will they spend significantly more because of this, I don’t think so.

  3. Early Access To Exclusive Deals (Actually just Exclusive Deals):
    Positives — Depends on quality of deals. Could lead to more orders & revenue
    Negatives — The deals on low ticket item products can put further pressure on shipping costs.

    The way I see it, I don’t expect great deals for Plus members. Let’s wait and watch on this.

  4. Superior & Priority Customer Service:
    Positives — Difficult to measure and communicate value to users. Negatives — If some changes are actually done at CRM, process and team levels. The costs for this could be significant.

    Unless a customer buys extremely regularly and interacts with CS often they can’t really see the difference. Even if the experience is better, I’d actually prefer to not having to talk to CS at all.

    Also, I’d never want customers to feel they are treated unequally. So generally speaking, I don’t like this feature.

  5. 3rd Party Offers and Reward Points:
    Positives — Additional benefit to customers, should bring some additional revenue from 3rd party. 
    Negatives — The offers currently are unpleasantly few and the usage terms are not friendly (to the point of discouraging impulse use).

    Giving formulaic reward points for purchases in form of coins could have been good had they allowed people to redeem them while shopping (think Paytm Cash) but in the current form, users can redeem coins to buy offers on 3rd party or Flipkart. First option currently is un-exciting and second one involves fair amount of friction
Expect a lot of low ticket orders like these

Unfriendly Terms: Of course I will remember all this two days in advance

Redeeming Rewards: 50 Coin Offers

50 Coin Offers 

Rs 250 earns you 1 Coin, so you need to spend Rs 12,500 to earn 50 coins. 
There’s also a catch, you can’t earn more than 10 coins in an order. So in effect, a user need to place multiple orders (5 big orders or 50 small ones) of Rs 250 or more to accumulate 50 coins.

Once a user has spend Rs 12,500 they are eligible for these offers 
– Rs 1000 worth free Flipkart Voucher (8% cashback)
– Rs 1200 worth BMS voucher or Rs 1900 worth Zomato Gold.

These offers are definitely interesting for regular customers as they get all these benefits for free.

Would people spend more often on Flipkart or move to Flipkart because of these benefits (more offers to come) would be interesting to see.


E-commerce Customer Lifecycle Management: Metrics and Goals

This is second part in a series of posts on ecommerce customer lifecycle management. In the first part we discussed an overview of CLM and in this post we’ll discuss how to identify, measure relevant customer lifecycle metrics and define goals to improve them.

Basic E-commerce Customer Lifecycle.

Pic 1: E-commerce Customer Lifecycle (Basic)

To improve progression of users through the lifecycle we will look at the corresponding funnel as funnels are great to measure stage wise conversion

Pic 2: Customer Funnel (Basic)

Quick Definitions

  1. Total Users: Users with email id/phone number/apn or gcm id.
  2. Total Customers: Users that have ordered at least once.
  3. Total Repeat Customers: Customers that have ordered more than once.
  4. Total Loyal Customers: Customers that have ordered more than Z times.

We’ve mapped the lifecycle into these four basic funnel stages because they represent a user action based milestone. This grouping of users is important because users in each stage share a lot of similarities in their experiences(or lack of) with the product and the kind of nudges required to help them move to the next stage.

Spray and Pray is not a Strategy

A mistake most marketers tend to make is to send the same communication to all users. It’s wrong to assume that the same communication will work for both ‘Non Purchasers’ and ‘Repeat Customers’.

Identifying Key Customer Lifecycle Metrics

The key metrics to be used have to be leading (or input) metrics i.e they are influenceable or directly actionable. In this case, the relevant metrics are the conversion rates from one stage to another. Let’s take some sample data

                           Pic 3: Overview of Customer Funnel

At a high level, this table above tells you all there is know about the business and the levers to improve things are the conversion rates that correspond to each stage.

                                        Retention is poorly understood

Key CLM Metrics aka E-commerce Vitals:

                                     Pic 4: Key CLM Metrics
  1. User Activation Rate
    = (Total Customers /Total Users) * 100
  2. Repeat Customer Rate
    = (Total Repeat Customers/Total Customers) * 100
  3. Loyal Customer Rate
    = (Total Loyal Customers/Total Repeat Customers) * 100

Loyal Customers = Users * Activation Rate * Repeat Rate * Loyal Rate

                                   CLM Metrics are Ecommerce Vitals

These Key CLM Metrics are E-commerce equivalent to the human body vitals.

As a growth guy, I lay extreme emphasis on these CLM metrics because they help me understand the current state of things and point towards directions that need the most work.

             Pic 5: Each Metric Tells A Story and Suggests A Direction to Work On

Defining Customer Lifecycle Management (CLM) Goals

With these three metrics identified, the task ahead is clear

Customer acquisition is just half the battle won.

                   Pic 6: Overview of Customer Data and Key Metrics

There can be 3 broad goals for improvement from here

  1. Increase User Activation Rate (Biggest Improvement Area) — An improvement by 5% here will translate into 20% increase across Customers, Repeat Customers and Loyal Customers
          Pic 7: User Activation Rate — The biggest lever of retention

Since User Activation Rate impacts the top of the customer funnel and a small improvement here will have the maximum impact in both customer count and revenue, it is paramount to improve it ASAP.

                  It’s important to fix User Activation Rate at the earliest

2. Increase Repeat Customer Rate (Toughest Improvement Area) — This is the second biggest improvement area. An improvement by 5% here will translate into 20% increase in both Repeat & Loyal Customers

       Pic 8: Repeat Customer Rate — The second lever of retention

If there are a lot of folks who are placing orders but aren’t coming back to buy again this could be a serious problem. This metric needs to be looked from multiple perspectives — Product Quality, Post Purchase Experience, Post Purchase Communication and such.

3. Increase Loyal Customer Rate (Easiest Improvement Area) — An improvement by 5% here will translate into 25% increase in Loyal Customers.

           Pic 9: Loyal Customer Rate — The third lever of retention

In my experience I’ve found this metric easier to influence than the repeat rate. Customers that have made multiple purchases are comparatively easier to retain & re-activate. You also have the most behavioural data about them.

Here’s a quick summary showing the impact of a 5% improvement in each key metric on One Time Purchasers, Repeat Customers and Loyal Customers.

Pic 10: Impact of a 5% improvement in each metric on Customers, Repeat Customers & Loyal Customers

The table above summarises the impact pretty neatly. In case, this is looking exciting, let me add to the excitement by showing you the improved numbers in a case where you are able to increase each key CLM metric by just 5%.

      Pic 11: Impact of 5% improvement across all three Key CLM metrics

Not only the % of people in each lifecycle stage looks quite better, the increase in loyal customers by 80% is fantastic

With these three broad CLM goals defined and projections explored, we have a task cut out for the marketing/growth team to make plans around.

In this post we’ve focused on identifying the Key CLM Metrics and Defining CLM Goals. In the next post in this series we’ll discuss some strategies to achieve these goals.

If this is the first post you are reading in this series, there’s a prequel to this post on introduction to Ecommerce Customer Lifecycle Management here

Thanks Navneet Singh and Saurabh Tuteja for their feedback

E-commerce Customer Lifecycle Management (CLM): An Introduction

This is the first part of a series of posts on e-commerce customer lifecycle management. In this post we’ll discuss an overview of CLM (The What & Why) and it should be useful for a marketing/growth person in designing their CLM strategy

A few things to note:

  • Analysing data only makes sense once you have a sizeable amount of it.
  • In this post we are only covering user and customer engagement.We will cover visitor data in a separate post
  • For sake of simplicity in this post we are only looking at linear movement across different lifecycle stages.

There are a lot of lenses to look at e-commerce customer behaviour data from but Customer Lifecycle Management(CLM) is at the core of it all. I believe CLM is the fundamental element that needs to be in place for you to drive good ROI on your marketing or growth efforts. Once you have a defined CLM framework, you can start focusing on other aspects. Let’s dig a little deeper


What is Customer Lifecycle Management?
Customer lifecycle is a term used to describe the progression of steps a customer goes through when considering, purchasing, using, and maintaining loyalty to a product or service.

Customer Lifecycle Management (CLM) is a framework to facilitate a smooth movement of users(non-purchasers) from acquisition towards loyalty (repeat active customers) by maximising the value delivered at each customer engagement touchpoint and removing all friction in conversion

                                    Pic 1: E-Commerce users’ Journeys


Why is it important to manage Customer’s Lifecycle?

  1. With limited customer acquisition channels, the customer acquisition costs will continue to rise unabated
  2. It is much easier to convert and retain an existing customer than to acquire a new one
  3. A happy customer will not only purchase more, they will also spread the word for you and bring additional customers.

Or put it other way,

You can’t build a sustainable e-commerce business without repeat customers

The Scope of Customer Lifecycle Management

Let’s briefly discuss what all does a CLM framework entail. We can divide the scope of work for CLM into the following

  1. Defining lifecycle stages, identifying relevant metrics and data
  2. Conceptualising categories of customer communication to nudge users from one lifecycle stage to the next
  3. Designing campaigns and creating content for categories defined above
  4. Executing various CLM campaigns and iterating on them to improve their efficacy.

Designing The Customer Lifecycle

While there’s no standard way to define a customer lifecycle for an e-commerce/transactional business, in my experience I’ve found this flow to do the job well.

                                           Pic 2: Customer Lifecycle (Basic)

This basic version of customer lifecycle is useful to get a high level overview and is easy to get started with.

                                        Pic 3: Customer Lifecycle (Advanced)

For the mature growth/marketing person, this advanced version of lifecycle will be beneficial. The advanced lifecycle is particularly beneficial for mid to large sized businesses.

I find this representation useful because it gives a more in-depth view of what exactly is happening in each lifecycle stage (Pic1). Also, by splitting various lifecycle stages by their purchase activity you get a better sense of how many customers are active, at risk of getting churned and have already churned.

Defining Lifecycle Stages
Before we jump to the metric, let’s quickly understand what each stage means.

                                     Pic 4: Definition of Various Lifecycle Stages

In this content, a couple key definitions one must understand are

  1. Risk Window — Number of days for which if a customer doesn’t purchase they are at risk of churning (X days).
  2. Churn Window — Number of days for which if a customer doesn’t purchase they are churned (Y days).

A churned customer is one who hasn’t purchased for long enough that we can consider them to be lost.

Repeat and Loyal Customers
There isn’t a definite way to define repeat and loyal customers. For sake of simplicity, I’ve defined repeat customer as anyone who has placed more than one order. Similarly, Loyal customers can be defined in multiple ways (orders/revenue etc) but I’ve defined them on the basis of number of orders (Z orders).

Depending on the nature of business, you can decide values for X,Y and Z

With the Customer Lifecycle in place, we now have to define our goals and make plans to achieve them. We’ll cover those in the remaining parts of the series.

Update: You can view the part two of the series in which we cover CLM Metrics and Goals here

Thanks Navneet Singh & Nitish Varma for reading the drafts.

Myntra’s End of Reason Sale in 7 images

# 1: A week or so back

The Build Up

YT ads promoting the sale
#2 Midnight on the day of sale

Midnight of Offer DayAs per Myntra’s twitter account, they were updating the offers


#3 Morning of the day of sale

Morning of the day of sale

Front double page ad on HT Delhi

#4 Minutes after the sale begins

Minutes after the sale began


Push notification to their app base (along with emails and sms)
#5 Few hours into the sale

Few hours into the sale

User Accounts (some say IPs) on both app and web were blocked for 30 minutes from making any request to the site

#6 Less than 12 hours into the sale

12 hours into the sale


#7 A little over 12 hours

end_myntra7

If the sequential order numbers of Myntra is anything to go by, the order id increased by over 1L  in the first 2 hours of the sale.

Time – 9:42 AM, Order id: 70303245

Time – 11:42 AM Order id: 70425987

Run rate: 60k orders/hour (16.67 orders/sec)


Inside the mind of an Indian online shopper: How & Where I spent my money online in 2014

Last year, around the same I time I posted a quick analysis of my spends across various e-comm sites. Thought of repeating the exercise again and see what all changed

1) Split of orders across sites

Split of Orders Across Sites


Not surprisingly, I placed the most orders in 2014 on Paytm (close to 70%), followed by Freecharge (8%), Flipkart (4.3%), Amazon & Bookmyshow. Various cashback schemes run on Paytm are the reason behind the skew of order count

Talking about physical goods #1 was Paytm (Aggressive offers early on), followed by Flipkart, Amazon & Jabong


2) Split of spend across sites

Split of Spend across sites


The story starts to clear up a bit when we look at split of spend across various sites

While 70% of orders I placed were on Paytm, 52% of the money I spent online went their. Flipkart (17.6%),  Jabong (14.1 %) & Myntra (3%) came next. The ticket size for Amazon has been quite less

3) Split of spend across categories

Split of spend across categories

This is quite revealing for me. While last year I spend considerable chunk of money (spent online) buying books, this year books formed a very small piece.

35% of money I spent shopping online last year, was spent on buying Electronics (mostly mobiles) & related Accessories. 25% was spent on recharges/bill payments and a significant change towards Fashion with 22% of my spend went there.

Some Interesting Bits:
1) I spent more ordering food online than buying books (Still can’t believe it or Maybe I got better deals at books 😉 )
2)  I spent more on Cab rentals than movies ( I don’t take cabs as much) and almost the same amount as I spent ordering food online
3) Between Fashion & Electronics – 57% of my money was spent

Purchase Summary
Orders placed: 321
Digital goods (recharges, bill payments and movies): 252

Money Spent: Rs 1,72,448
Money spent on Physical goods: 1,24,621

Closing Thoughts/points
1) I’m not the most savvy online purchaser but I do tend to compare prices before buying stuff and have started using mysmartprice and more recently  buyhutke (Chrome plugin)
2) Online mega sales trigger my purchases (super surprised to find out, I ordered on Myntra this GOSF after a break of 1 year from last GOSF). Made purchases on Big Billion Day and even Myntra’s “End of Reason” sale today
3) While I preferred purchasing on desktop (ease of selection, multiple tables, price comparison etc). I’ve started buying stuff straight of mobile. While for many purchases mobile still serves as the initiation point of my purchases and the same happens other way around, I add items to cart on web only to order them later on mobile when free
4) Most of my purchases (especially Fashion) are impulse (discount driven If I can admit), while Electronics etc are kinda planned
5) I’ve jumped the ship completely when it comes to paying by card. Almost, all my purchases (90% +) are pre-paid now.
6) Myntra and Jabong have spoiled me with their super easy return/exchange policies and flow. I don’t think twice before ordering stuff from them as I know I can always get the product returned/exchanged if I don’t like it. They also have superb delivery timelines (24 hours is a regular)
7) One thing I miss shopping online, is “Lack of Price Protection”. What you buy today for Rs 5000 can be available for say Rs 4000 and Rs 3500 the next day. As a buyer, you obviously feel bad about it
8) Newly caught trend of using wallets to pay on various sites to get discounts and cashbacks is a good incentive to use them. I’ve used Paytm, mobikwik and Payumoney, depending on the offers they are running.
9) I’m yet to order specs, furniture, grocery, health & wellness and things from a lot of these categories
10) Product wise – Wishlist and Rating/Reviews are by far the most useful features. Also, I love the feature to sort/filter using discount/offers (or the lack of them).

Hope, this post would help folks working in e-commerce get “some more idea” of their *Customers*


2013: My year on Indian e-commerce sites

Just had this idea of checking and analyzing how much money I spent on various e-commerce sites and doing what. So here’s a quick post sharing the same with the hope that it might be of interest of people running various e-commerce sites or thinking of doing so in future.

In the year 2013 I swiped card/availed COD across Flipkart, Jabong, Myntra, Amazon etc. Here’s quick glance of my purchases

1) Flipkart – Items Purchased: 58, Amount Spent: Rs 50,218

items purchased on flipkart
Split of items
Split of amount spent
Average price of a book I purchased on Flipkart is Rs 299 and average price of a footwear is Rs 876 (3 shoes and 4 sandals/flip flops)

2) Amazon.in – Items Purchased: 7, Amount Spent: Rs 6,598

Great thing about Amazon is that it already provides you an option to see all the purchases you made in that year
Search Order HistoryHere’s the split of purchases (6 books worth Rs 1,599 and a Kindle worth Rs 4,999)

Split of purchases on Amazon.in

3) Jabong – Items Purchased: 1, Amount Spent: Rs 1280

*I actually bought two items but had to return one for poor quality (return process was super smooth though)

Purchased a clothing item worth Rs 1280 during GOSF

4) Myntra – Items Purchased: 2, Amount Spent: Rs 3854/-

Purchased two clothing items worth Rs 3,854/- during GOSF

5) Others

a) Yepme: Items Purchased: 2, Amount Spent: Rs 998/-
b) Inkfruit: Items Purchased: 7, Amount Spent: Rs 3,738/-
c) Shopclues: Items Purchased: 1, Amount Spent: Rs 42/-
d) Bookadda: Items Purchased: 1, Amount Spent: Rs 667/-
e) Purplle.com: Items Purchased: 1, Amount Spent: ~ Rs 2500/-

Summary (Items Purchased: 80, Amount Spent: Rs 69,895/-, Spent some 8K during GOSF, alone, Spent some 11K on online bill payments/recharges)
item_vs_amount

A peak into my mind as an online shopper
1) Convenience very important but not more important than discounts. Moved my bill payments online. I do all my bill payments and DTH recharges on Paytm
2) Almost all my purchases have been via desktop (haven’t got myself to buying things via apps/mobile site yet.)
3) I’ve crossed the chasm from COD to swiping cards. I now prefer to pay online for most of my purchases. I don’t hesitate to swipe card for my first purchase on sites I’ve heard good deal about (Myntra, Jabong, Shopclues etc). Earlier my first purchase on a new site was on COD
4) I got comfortable enough to made a big ticket purchase (bought a laptop for around 30K from Flipkart)
5) Discounts/Offers have an influence on my purchase behaviour (both on pre-decided buys and impromptu purchases). I spent some
6) I trust most sites to deliver goods on time, offer quality goods and a customer friendly return/exchange policy
7) Flipkart’s scan (barcode) and search feature is quite handy for a quick online vs offline price comparison
8) I’ve grown to compare prices across sites before buying anything. I definitely use mysmartprice to compare book prices
9)  Wishlists and notifications are a great way for me to store items and decide when to purchase
10) As a heavy user I’ve figured some hacks to avail the max discount on certain items across some sites;-)


Analyzing Amazon.in Checkout Process

I recently made a purchase on Amazon.in and couldn’t but wonder at their checkout process. Just too many clicks for comfort.
Here’s how it works at present

Step 1) Product Page 

Product Page - Amazon.in


Step 2) Edit Cart or Proceed Page

Edit Cart or Proceed - Amazon.in


Step 3) Sign in/Sign up Page

Login/Sign up Page - Amazon.in


Step 4) Delivery address Page

Delivery Address - Amazon.in

Step 5) Delivery options page

Delivery Options - Amazon.in

Step 6) Payment Method Page

Payment Method Page - Amazon.in


Step 7) Review Order Page

Review order page - Amazon.in


Step 8) Billing Address Page

Billing Address Page - Amazon.in


Step 9) Order Completion Page

Order Completion Page - Amazon.in


Phew !! With these many clicks Amazon is making sure that only the users absolutely committed to make a purchase are the ones who make one.

Nine steps to the order confirmation page. Wow. Let’s try to see if we can make things a bit better (less clicky)

  1.  The easiest way around would have been to allow ‘1-click checkout’. Which for some reason isn’t available.
  2. Step 2: The importance of this page is to help those who want to review their cart. Not sure why would Amazon want people to doubt their purchase, unless they have over the period seen people change their cart contents during later stages of checkout or raised a of issues complaining of shopping wrongly.They should encourage users to add more items ala ‘Continue Shopping’ as it is popularly known or checkout. Ideally, however there should be an analysis of the % of people who buy 1 item vs % of people who buy multiple items. The experience should be made smoother for the majority case. It could just be a pop up and not a new page
  3. Step 3: Is an important one. Auto-saved credentials make things easier. I am not getting into the design of the page as in this case, it gets the job done in a single click
  4. Step 4 and 5 : I don’t really feel the need of having two separate pages for choosing delivery address and delivery options unless there are multiple addresses and options in question. The assumption here is most people would order to a single address. This could however be validated by data on median delivery addresses. Assuming most people will not change their address during the flow, I think in the step 5 there should be an option to change address without giving it a separate page.
    UI could definitely be improved 🙂Delivery Address and Options Page - Amazon.in
  5. Step 6: This is perhaps the most important page. The option of putting saved cards makes things easy. Just enter CVV and continue. The layout of other payment options is a discussion to be had another day
  6. Step 7: ‘Review Order’. Wait, why would I want to review order after putting my payment details? Shouldn’t this page come before the payments page?  Step 7 should be Step 6. And Step 6 should be Step 7 with an option (selected by default ) “billing address to be same as shipping address”. An option to change billing address is going to be there of course. I simply don’t see a reason to have Step 8 “Choosing Billing Address” as a separate page.
  7.  Step 9: Order completion page. Informative and having some baits for users to view more items or make another purchase .So here’s the revised flowStep 1 (Product Page) – Page 1
    Product Page - Amazon.in
    S
    tep 2 (Continue Shopping vs Checkout) to come as a popup on clicking Buy from product page and not a separate page
    Edit Cart or Proceed - Amazon.in
    S
    tep 3 (Sign in/Sign up Page)- Page 2

    Login/Sign up Page - Amazon.inStep 4 (Delivery Address and Options Page) – Page 3

    Delivery address and options page - Amazon.in

    Step 5 (Review order page) – Page 4

    Review order page - Amazon.in
    Step 6 (Payments Page with Billing Address option) – Page 5

    Payment Method Page - Amazon.in
    Billing address option could also be a part of the delivery address and options page. But in no case it deserves a separate page

    Step 7 (Order completion page) – Page 6

    Order Completion Page - Amazon.in
    Though in the new order we are down to Six pages from Nine (33.33% lesser pages). I am sure this can be optimized by at least one more page by clubbing ‘Review Order’ and ‘Delivery Address and Options’ Page. For now 5 pages are good enough.

    Eventually a one click checkout for single product purchases is in order .

    What do you think?

Assocham-Comscore State of eCommerce in India – Report

In Sep 2012 Assocham together with Comscore came out with a report on the Indian ecommerce Scene. It had some known and some new stats/key points. You can download the report here

Here are the main points 

Demographics
  1. 75% of online audience between the age group of 15-34 years
  2. Female population is about 40% of total users (July 2012)
Travel
  • The penetration in India is about 44% which is higher than the world average for travel
  • IRCTC get about 19.2% of all Indian online traffic (highest – 12mn uniques/month) followed by Makemytrip
  • Redbus gets about 2%
  • Surprise: Content type sites for ex: indiarailinfo (3.2%) and mustseeindia (2.3%)
  • Travelyaari and Makemytrip (2.3 mn uniques a month)
Retail
  • The penetration in India is about 60% which is lower than the world average for retail (72%)
  • Amazon gets about 15.4%, Flipkart (11.5% – 7.4 mn uniques/month), Snapdeal (11.1% – 6.9 mn uniques/month) of all India online traffic
  • Apparel is the most growing subsegment in retail
  • Flowers/gifts/greetings is the only subsegment with negative growth – 33% (Our coupons??)
Breakup of Payment Methods in India
  1. Direct Debit – 58% with avg transaction of 20$ (lowest)
  2. Visa – 21% with avg transaction of 48$
  3. Master card – 12% with avg transaction of 47$
  4. Cash on Delivery – 7% with avg transaction of 33$
  5. Others – 2% with avg transaction of 43$
  6. American Express cards apparently have the highest avg transaction size of 110$
IRCTC Specific Info 
  • SBI and SBI Direct – 29 +26 = 55% of all transactions
  • ICICI (17%), HDFC (14%)
  • Do a revenue of about 38 Cr
 Future 
  • Car rentals and bus booking online should go further up
  • home furnishing and lifestyle goods to contribute more
  • comparison shopping sites/apps to get more popularity

The Rise of the Indian Online Marketplace

If you are part of/related to the Indian e-commerce scene in any manner or read desi start-up blogs, chances are you might be familiar with the concept of Marketplace.

A “Marketplace” connects buyers and sellers who otherwise have trouble finding each other.

Marketplace(think eBay), is simply a model which has multiple sellers providing various goods/services through a platform. In the context of this discussion, an e-commerce website instead of sourcing and fulfilling the orders just manages the listing of products and passes on the order details to the sellers who then handles them.

Recently, India’s biggest online retailer (Flipkart) made their first move as a part of shift towards the marketplace set up.

To start with, Flipkart has on-board 50 sellers that will sell books, media, and consumer electronics.

Other Indian online retailers on scaled up marketplace model are Snapdeal(which recently raised $ 50 mn from ebay and others), Tradus, Infibeam and Shopclues. Let’s understand how the marketplace model and inventory led model compare in execution

The key components of an e-commerce set up are

  1. Customer Acquisition
  2. Catalog
  3. Technology (Customer facing/related and backend)
  4. Inventory
  5. Fulfillment (Sourcing, Packaging and Delivery)
  6. Payment Processing
  7. Customer Service/Support

Setting everything up for a rookie is quite demanding (capital and effort wise) and will take months to get off the ground, however to signup as a seller on a marketplace and/or opening a shop using SaaS based ecommerce store building platforms like Zepo, Buildabazaar or Martjack is a quickie. So for a newbie it makes perfect sense to open up their own shop (SaaS) and list on various marketplaces as a seller

Based on one’s expertise and priorities there are various ways of building the e-commerce store set up. For eg: while someone will prefer to control the last mile delivery experience, someone would rather let logistics companies take care of that.

The most common model is mix of Inventory led and Marketplace both (think Amazon). Here’s how it works

  1. Inventory Led – Short Tail (Fast moving, Commodity products, Easy to warehouse for ex: best selling books/movies/pendrives etc)
  2. Marketplace – Long Tail (Slow moving, Niche products, Difficult to warehouse for ex: medical books published in hindi/very old foreign language films/Furniture etc)

While it might not very clear from the examples but Inventory led model makes sense for products which aren’t perishable(both utility and demand/vogue), are easily available offline too and move fast enough while the Marketplace model makes sense for products which one doesn’t know exist or even if one knows they don’t have any clue on how to stock them, how to source them etc.

Customer Acquisition,Technology,Payment Processing and Customer Support are done by the e-commerce company.

Here’s how various models are implemented in some of the biggest Indian e-commerce companies.

break_up

A couple questions come to the the curious mind.

  1. Why sudden rush towards Marketplace all across?
  2. Is Marketplace the future of e-commerce in India?

1. Why sudden rush towards Marketplace all across?

The answer to that question (from what I’ve heard) lies in the deep VC pockets. With the Govt of India dillydallying around the FDI regulations for e-commerce, apparently Marketplace is the only way to get external funding needed to sustain the business.

Also, it could be because the bigger e-commerce companies have figured out that

a) they can’t possibly go that strong on increasing the  quality/quantity of the catalog on their own
b) they ran sick and tired of doing everything on their own.

To get a sense, compare how Flipkart was managing these functions in it’s previous avatar and compare it to say Snapdeal


break_up1

2. Is that the future of e-commerce in India?

On doing some rough calculations based on the information available Flipkart, Infibeam, Snapdeal, Jabong, Bookadda and Homeshop together would be doing around 1,15,000 orders a day (Flipkart and Snapdeal contributing about 60-70 %).

There are a lot more sites (ending with kart and otherwise) who just might be doing another (20-30,000 transactions or more a day)

As per my guesstimate all independent smaller e-commerce websites and platform powered online shops selling long tail products would be doing not more than 5-10,000 orders a day.These numbers could be significantly different from the mark for all we know but based on these numbers before marketplace became the buzzword, top 5-6 established players were doing about 90,000-95,000 orders a day in total while the others in long tail were about 5-10% of their size.

The balance has started to shift towards the marketplace model transactions. For now their share could be 10-15% of the overall e-commerce transactions.  Going forward we’ll a lot more smaller businesses and niche startups coming online and by 2013 end their share could be upwards of 20-25%(going by the fact that between Flipkart and Snapdeal they are the biggest online retailers).

A couple of factors to speed this up would be

  1. More platforms like Buildabazaar and Zepo
  2. Better payment gateway/cash collection mechanisms (Ghar pay etc)
  3. Better logistics (for end to end fulfillment)
  4. Third party SaaS services for other components like (Catalog, Warehousing, Customer Support)
  5. Some VC investment in 1-2 marketplace companies

The sooner we get to see the above mentioned things rolling the faster we’ll get to the long tail moving online. At some time in the  mid term future(5-7 years) the demand for long tail items (Niche/scarcely available/custom made) products could become comparable if not more than the demand for short tail products.

So the marketplace model and independent shops powered by various sites are here to stay and the current biggies like Flipkart, or maybe Snapdeal will evolve into a mix of (Short tail – Inventory led – Self Fulfilled and Long tail – marketplace – Logistics company) models.

Your thoughts?