Category Archives: analytics

E-commerce Customer Lifecycle Management (CLM): An Introduction

This is the first part of a series of posts on e-commerce customer lifecycle management. In this post we’ll discuss an overview of CLM (The What & Why) and it should be useful for a marketing/growth person in designing their CLM strategy

A few things to note:

  • Analysing data only makes sense once you have a sizeable amount of it.
  • In this post we are only covering user and customer engagement.We will cover visitor data in a separate post
  • For sake of simplicity in this post we are only looking at linear movement across different lifecycle stages.

There are a lot of lenses to look at e-commerce customer behaviour data from but Customer Lifecycle Management(CLM) is at the core of it all. I believe CLM is the fundamental element that needs to be in place for you to drive good ROI on your marketing or growth efforts. Once you have a defined CLM framework, you can start focusing on other aspects. Let’s dig a little deeper


What is Customer Lifecycle Management?
Customer lifecycle is a term used to describe the progression of steps a customer goes through when considering, purchasing, using, and maintaining loyalty to a product or service.

Customer Lifecycle Management (CLM) is a framework to facilitate a smooth movement of users(non-purchasers) from acquisition towards loyalty (repeat active customers) by maximising the value delivered at each customer engagement touchpoint and removing all friction in conversion

                                    Pic 1: E-Commerce users’ Journeys


Why is it important to manage Customer’s Lifecycle?

  1. With limited customer acquisition channels, the customer acquisition costs will continue to rise unabated
  2. It is much easier to convert and retain an existing customer than to acquire a new one
  3. A happy customer will not only purchase more, they will also spread the word for you and bring additional customers.

Or put it other way,

You can’t build a sustainable e-commerce business without repeat customers

The Scope of Customer Lifecycle Management

Let’s briefly discuss what all does a CLM framework entail. We can divide the scope of work for CLM into the following

  1. Defining lifecycle stages, identifying relevant metrics and data
  2. Conceptualising categories of customer communication to nudge users from one lifecycle stage to the next
  3. Designing campaigns and creating content for categories defined above
  4. Executing various CLM campaigns and iterating on them to improve their efficacy.

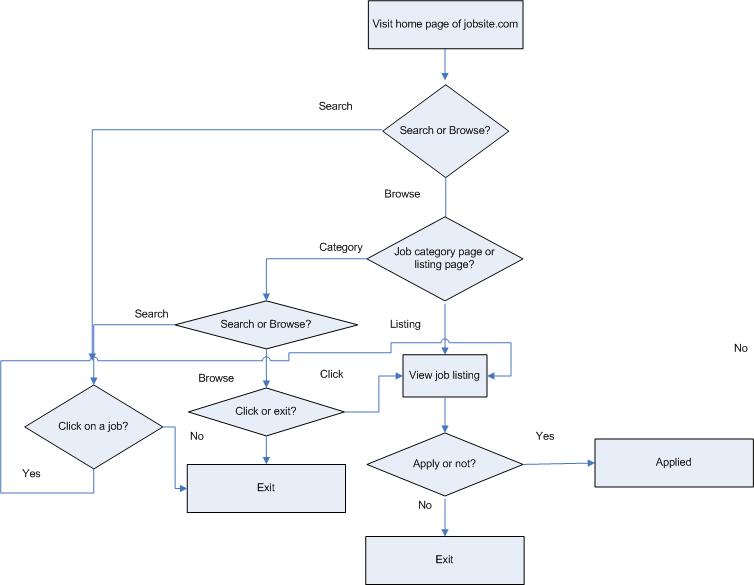
Designing The Customer Lifecycle

While there’s no standard way to define a customer lifecycle for an e-commerce/transactional business, in my experience I’ve found this flow to do the job well.

                                           Pic 2: Customer Lifecycle (Basic)

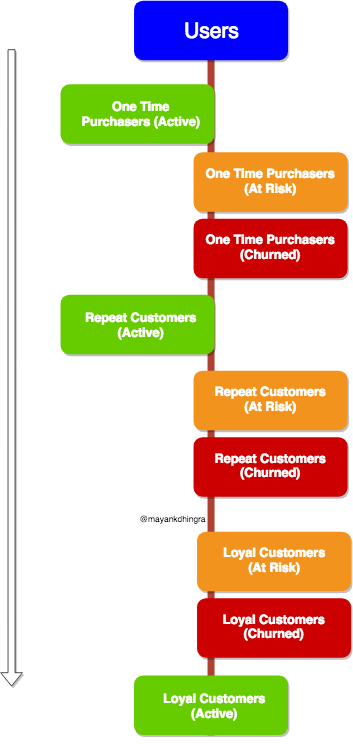
This basic version of customer lifecycle is useful to get a high level overview and is easy to get started with.

                                        Pic 3: Customer Lifecycle (Advanced)

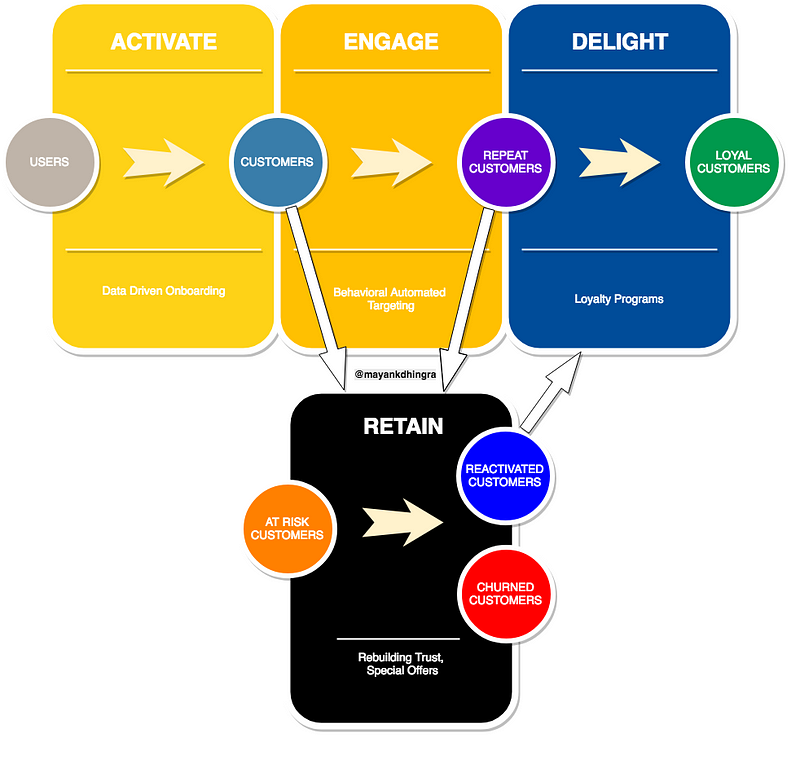
For the mature growth/marketing person, this advanced version of lifecycle will be beneficial. The advanced lifecycle is particularly beneficial for mid to large sized businesses.

I find this representation useful because it gives a more in-depth view of what exactly is happening in each lifecycle stage (Pic1). Also, by splitting various lifecycle stages by their purchase activity you get a better sense of how many customers are active, at risk of getting churned and have already churned.

Defining Lifecycle Stages
Before we jump to the metric, let’s quickly understand what each stage means.

                                     Pic 4: Definition of Various Lifecycle Stages

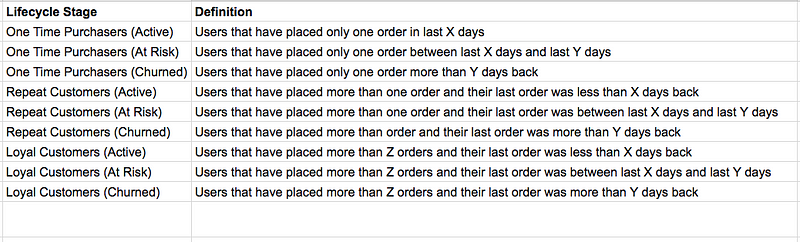
In this content, a couple key definitions one must understand are

  1. Risk Window — Number of days for which if a customer doesn’t purchase they are at risk of churning (X days).
  2. Churn Window — Number of days for which if a customer doesn’t purchase they are churned (Y days).

A churned customer is one who hasn’t purchased for long enough that we can consider them to be lost.

Repeat and Loyal Customers
There isn’t a definite way to define repeat and loyal customers. For sake of simplicity, I’ve defined repeat customer as anyone who has placed more than one order. Similarly, Loyal customers can be defined in multiple ways (orders/revenue etc) but I’ve defined them on the basis of number of orders (Z orders).

Depending on the nature of business, you can decide values for X,Y and Z

With the Customer Lifecycle in place, we now have to define our goals and make plans to achieve them. We’ll cover those in the remaining parts of the series.

Update: You can view the part two of the series in which we cover CLM Metrics and Goals here

Thanks Navneet Singh & Nitish Varma for reading the drafts.

2013: My year on Indian e-commerce sites

Just had this idea of checking and analyzing how much money I spent on various e-commerce sites and doing what. So here’s a quick post sharing the same with the hope that it might be of interest of people running various e-commerce sites or thinking of doing so in future.

In the year 2013 I swiped card/availed COD across Flipkart, Jabong, Myntra, Amazon etc. Here’s quick glance of my purchases

1) Flipkart – Items Purchased: 58, Amount Spent: Rs 50,218

items purchased on flipkart
Split of items
Split of amount spent
Average price of a book I purchased on Flipkart is Rs 299 and average price of a footwear is Rs 876 (3 shoes and 4 sandals/flip flops)

2) Amazon.in – Items Purchased: 7, Amount Spent: Rs 6,598

Great thing about Amazon is that it already provides you an option to see all the purchases you made in that year
Search Order HistoryHere’s the split of purchases (6 books worth Rs 1,599 and a Kindle worth Rs 4,999)

Split of purchases on Amazon.in

3) Jabong – Items Purchased: 1, Amount Spent: Rs 1280

*I actually bought two items but had to return one for poor quality (return process was super smooth though)

Purchased a clothing item worth Rs 1280 during GOSF

4) Myntra – Items Purchased: 2, Amount Spent: Rs 3854/-

Purchased two clothing items worth Rs 3,854/- during GOSF

5) Others

a) Yepme: Items Purchased: 2, Amount Spent: Rs 998/-
b) Inkfruit: Items Purchased: 7, Amount Spent: Rs 3,738/-
c) Shopclues: Items Purchased: 1, Amount Spent: Rs 42/-
d) Bookadda: Items Purchased: 1, Amount Spent: Rs 667/-
e) Purplle.com: Items Purchased: 1, Amount Spent: ~ Rs 2500/-

Summary (Items Purchased: 80, Amount Spent: Rs 69,895/-, Spent some 8K during GOSF, alone, Spent some 11K on online bill payments/recharges)
item_vs_amount

A peak into my mind as an online shopper
1) Convenience very important but not more important than discounts. Moved my bill payments online. I do all my bill payments and DTH recharges on Paytm
2) Almost all my purchases have been via desktop (haven’t got myself to buying things via apps/mobile site yet.)
3) I’ve crossed the chasm from COD to swiping cards. I now prefer to pay online for most of my purchases. I don’t hesitate to swipe card for my first purchase on sites I’ve heard good deal about (Myntra, Jabong, Shopclues etc). Earlier my first purchase on a new site was on COD
4) I got comfortable enough to made a big ticket purchase (bought a laptop for around 30K from Flipkart)
5) Discounts/Offers have an influence on my purchase behaviour (both on pre-decided buys and impromptu purchases). I spent some
6) I trust most sites to deliver goods on time, offer quality goods and a customer friendly return/exchange policy
7) Flipkart’s scan (barcode) and search feature is quite handy for a quick online vs offline price comparison
8) I’ve grown to compare prices across sites before buying anything. I definitely use mysmartprice to compare book prices
9)  Wishlists and notifications are a great way for me to store items and decide when to purchase
10) As a heavy user I’ve figured some hacks to avail the max discount on certain items across some sites;-)


The Conversion Funnel – Part One

The concept of conversion funnel is quite old and surprisingly still not as widely used/referred to.  Be it an e-commerce website or a social network, there are two, rather three aspects of workflow and analytics

  1. Getting customers – Acquisition
  2. Getting them to do “something”  –  Conversion
  3. Getting them do “something” again and again – Retention

For e-commerce sites aka pipes the conversion is applicable for customers only, while for social networks and other sites aka platforms where value is created and consumed by two parties we have to keep in mind conversion for both of them to be able to achieve the end goal.

Let’s consider a job portal and see what the conversion funnel for it will look like.

  1. Visit to home page
  2. Visit to job category page
  3. Visit to job listing page
  4. Apply to job

Note: All these steps don’t necessarily need to be followed in the same order. For ex:  A visitor can land directly at a job listing page via Google search

The above mentioned four points are the simplest way to accomplish task of applying for a job but there could be a lot of other variants which though complex/indirect but would still reach to same goal.  For instance instead of clicking on a job category page link the user does a search and goes to search listing page. One way to look at such alternate paths is to create a funnel for each one of them

conversion_funnel_jobssite1

These are some of the possible routes (for ex: some visitors would neither search or browse and just exist from home page itself). In best case scenario you should know precisely the split of people who searched, browsed and  existed. Further, you should create separate funnels or each search and browse loops.

Let’s say the home page had 100 visitors. Searched = 30, Browsed = 55, Exits = 15

The conversion funnel for search would look like

Visits (100) -> Search (30) ->  View job listings(10) -> Apply(2)

The conversion funnel for browse would look like

Visits (100) -> Browse(55)
1) ->  View job category page (15) -> View job listings(10) -> Apply(3)
2) ->  View job listings(40) -> Apply(5)


By considering  the drop off at each stage you would be able to pin point the problem. For instance if  only 1/3rd people are clicking to view job listings after search, maybe the search isn’t that efficient and needs to be worked upon. You could further zoom into this by dividing all searches into two categories.

  1. Searches for which some results were shown (20)
  2. Searches for which no results were shown (10)

In the above example only 20 searches had results against them, which means the click through rate for search is 50% and not 33% as perceived earlier. Now could consider improving this rate and on the side figure out how to reduce the cases in which no search results were shown.

Similarly from View listing to Apply. You can break this task into the below mentioned to be able to see the exact stage of drop off

View job listing -> Click Apply Button -> Login/Signup -> Apply

I’d end this post by stating that, you should try to use the workflows/flowcharts to identify various stages of a user goal and then analyze data across them to be able to identify the issues and fix them

To be continued…

First Google Analytics Conversion Univeristy Conference in India

I along with a few friends from Twitter attended the Google Analytics Conversion University Conference at Gurgaon. This was the first such conference by Google Analytics in India and we were lucky enough to be a part of it. The agenda of conference included introduction of GA for begineers, sharing more about their partnership programs, advanced features, adsense/adwords integration, webmaster tools and website optimizer.

The conference had about 100 attendees(or less?) from mostly, sem/ppc background. Folks from Digital Agencies and SEM companies formed the major chunk. Interestingly enough about one third of the attendees were from outside Delhi/NCR, with people from Mumbai and Kerala forming a considerable chunk. Most of the speakers too were from outside of Delhi with Jesse coming straight from Mountain View to present at the conference.

Given the professional and business oriented audience, the content was strictly focussed around getting most out of GA and eventually how you can use it to get more/spend less $$. The thing about analytics is that everyone knows it but not everyone does it, so the conference was a good reminder that you need to actually checkout the data being captured and use it to drive results.

Jesse made his point by saying “Not having goals on GA is like being a 35 year old guy who doesn’t have a job and doesn’t know what to do with his life, no goals” . So if you too haven’t configured goals in your GA, it’s time to do it and if you don’t know how to go about it, ping  me.

Tracking Bounce Rate, Outgoing Traffic, Custom Segmentation etc were some other things that I was reminded to spend some time on. BTW Are you tracking them ?

The best thing about Google Analytics(other than the fact that it works) is that its FREE, free not just for individuals but free for enterprises. Isn’t that cool ? Another great thing is that you as individual get access to the same set of features that an enterprise gets, i.e. it’s not that the free version has lesser features than paid enterprise ones.

Is it a good question to ask if Google Analytics is free, how does  Google benefit ?
Vivek, one of the speakers mentioned that amongst other things GA drives more money to adwords. Fair enough

All in all, GA conf @ Google’s gurgaon office was a fun event with great learning and networking opportunity.Good food and free wi-fi were nice addons.

You can also checkout people’s tweets by searching for hashtag #gacu

Thanks to the guys at getgaready for organizing it.

Conference Goodies

1) GA Tooth Brush: Yes, a Tooth Brush that reads “promoting good website hygiene”

GA tooth brush2) GA Thumb/Pen Drive:

GA Thumb Drive

3) GA Tee-Shirt:

GA Tee Shirt

Update: Here’s Tatvic’s presentation on Conversion Tracking from the conference

View more presentations from anilv13.

Google Analytics Conference in Gurgaon: 8th August

Hey Guys,

Wanted to share the news that there’s going to be a Google Analytics Conference under Google’s “Conversion University” in Gurgaon next month.

converation_university

The speakers for the conference include

conference_speakersYou can checkout the complete list here.

The event is completely FREE of charge. You can Register on the website and your attendance will be confirmed by email a week before the event. The invite is non-transferable and there will be no spot registration.

Here’s the agenda for the conference

conv_agenda

Date: 8th August

Place: Gurgaon

Venue:  Google India Pvt Ltd, 8th and 9th Floors, Tower C Building No.8, DLF Cyber City, Gurgaon, India.

Map:
http://www.getgaready.in/venue.html

Checkout  http://www.getgaready.in/ for more details