Paypal Mafia, Luck Vs Hard Work, Life in Weeks, History of Email Marketing & more
A very crisp and interesting read on the evolution of Email Marketing and a brief look at things to come. Find more here
“Luck matters more in an absolute sense and hard work matters more in a relative sense”. James Clear gets deeper into the ‘Luck Vs Hard Work’ question. Learn more here
As Google marks their 20th anniversary, here’s a first look at the next chapter of Search, and their plan make information more accessible and useful for people everywhere. Discover more here
“The stock market is a place to make easiest money in the hardest way. The path is very complex, and you never get answers to a lot of things”. Read more here
Stupid, Aggressive or Smarter? How are Digital devices altering our brains? Read more here
Rewind (Best of newsletter #70)
1) ‘How To Tell The Truth’ by Ben Horowitz. Read it here
3) Your Life in Weeks by Tim Urban(Waitbutwhy). Read here
Video of the Week: The Incredible Story of The PayPal Mafia. Watch here
Startup Trivia of the Week: OYO In 2015, OYO was delisted from Makemytrip, Goibibo and Yatra. Around that time Goibibo also launched GoStays, a competitor to OYO. Back then OYO claimed only 10% of their business came from these aggregators. The status quo continued till Oct-2017 when Yatra decided to re-list OYO.In Feb-2018, MMT (and Goibibo) also re-listed OYO. Source
Feel free to forward this newsletter to anyone who might appreciate it. If you’re getting this email from a friend, you can subscribe here.
This is second part in a series of posts on ecommerce customer lifecycle management. In the first part we discussed an overview of CLM and in this post we’ll discuss how to identify, measure relevant customer lifecycle metrics and define goals to improve them.
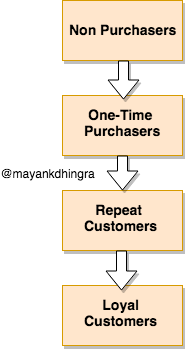
Basic E-commerce Customer Lifecycle.
Pic 1: E-commerce Customer Lifecycle (Basic)
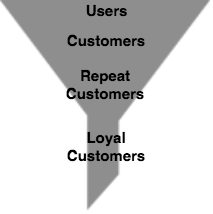
To improve progression of users through the lifecycle we will look at the corresponding funnel as funnels are great to measure stage wise conversion
Pic 2: Customer Funnel (Basic)
Quick Definitions
Total Users: Users with email id/phone number/apn or gcm id.
Total Customers: Users that have ordered at least once.
Total Repeat Customers: Customers that have ordered more than once.
Total Loyal Customers: Customers that have ordered more than Z times.
We’ve mapped the lifecycle into these four basic funnel stages because they represent a user action based milestone. This grouping of users is important because users in each stage share a lot of similarities in their experiences(or lack of) with the product and the kind of nudges required to help them move to the next stage.
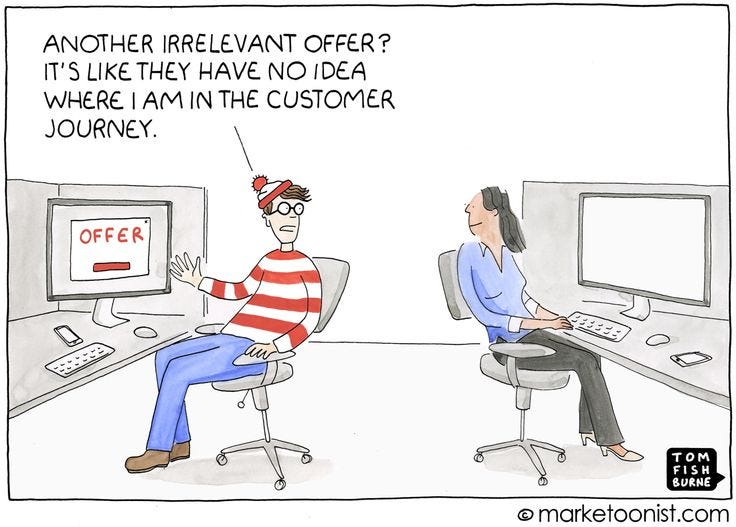
Spray and Pray is not a Strategy
A mistake most marketers tend to make is to send the same communication to all users. It’s wrong to assume that the same communication will work for both ‘Non Purchasers’ and ‘Repeat Customers’.
Identifying Key Customer Lifecycle Metrics
The key metrics to be used have to be leading (or input) metrics i.e they are influenceable or directly actionable. In this case, the relevant metrics are the conversion rates from one stage to another. Let’s take some sample data
Pic 3: Overview of Customer Funnel
At a high level, this table above tells you all there is know about the business and the levers to improve things are the conversion rates that correspond to each stage.
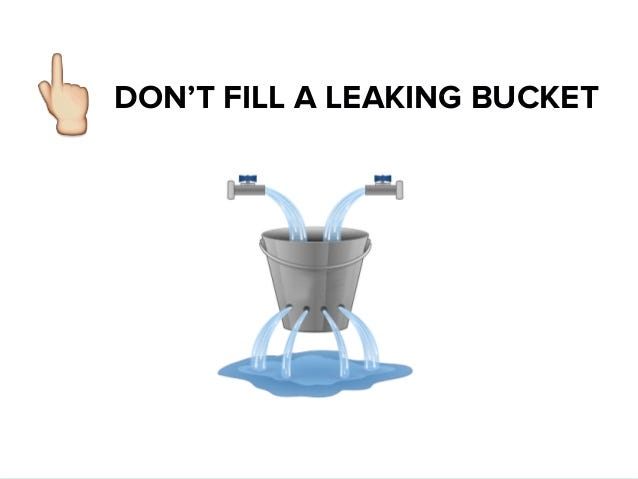
Retention is poorly understood
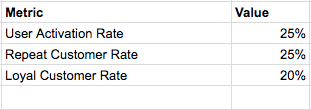
Key CLM Metrics aka E-commerce Vitals:
Pic 4: Key CLM Metrics
User Activation Rate
= (Total Customers /Total Users) * 100
These Key CLM Metrics are E-commerce equivalent to the human body vitals.
As a growth guy, I lay extreme emphasis on these CLM metrics because they help me understand the current state of things and point towards directions that need the most work.
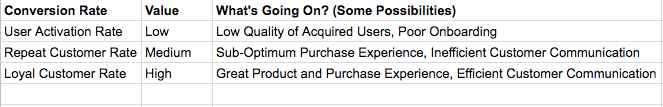
Pic 5: Each Metric Tells A Story and Suggests A Direction to Work On
With these three metrics identified, the task ahead is clear
Customer acquisition is just half the battle won.
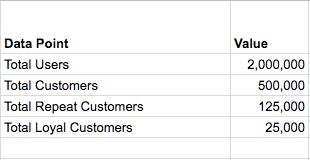
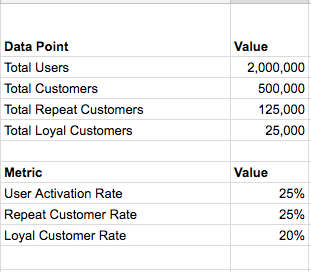
Pic 6: Overview of Customer Data and Key Metrics
There can be 3 broad goals for improvement from here
Increase User Activation Rate (Biggest Improvement Area) — An improvement by 5% here will translate into 20% increase across Customers, Repeat Customers and Loyal Customers
Pic 7: User Activation Rate — The biggest lever of retention
Since User Activation Rate impacts the top of the customer funnel and a small improvement here will have the maximum impact in both customer count and revenue, it is paramount to improve it ASAP.
It’s important to fix User Activation Rate at the earliest
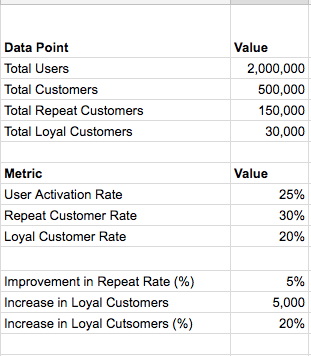
2. Increase Repeat Customer Rate (Toughest Improvement Area) — This is the second biggest improvement area. An improvement by 5% here will translate into 20% increase in both Repeat & Loyal Customers
Pic 8: Repeat Customer Rate — The second lever of retention
If there are a lot of folks who are placing orders but aren’t coming back to buy again this could be a serious problem. This metric needs to be looked from multiple perspectives — Product Quality, Post Purchase Experience, Post Purchase Communication and such.
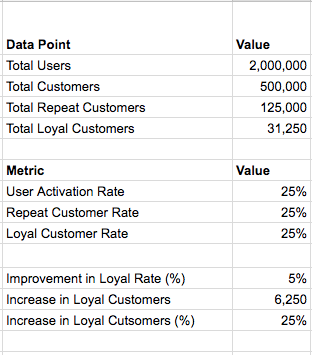
3. Increase Loyal Customer Rate (Easiest Improvement Area) — An improvement by 5% here will translate into 25% increase in Loyal Customers.
Pic 9: Loyal Customer Rate — The third lever of retention
In my experience I’ve found this metric easier to influence than the repeat rate. Customers that have made multiple purchases are comparatively easier to retain & re-activate. You also have the most behavioural data about them.
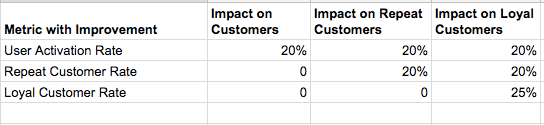
Here’s a quick summary showing the impact of a 5% improvement in each key metric on One Time Purchasers, Repeat Customers and Loyal Customers.
Pic 10: Impact of a 5% improvement in each metric on Customers, Repeat Customers & Loyal Customers
The table above summarises the impact pretty neatly. In case, this is looking exciting, let me add to the excitement by showing you the improved numbers in a case where you are able to increase each key CLM metric by just 5%.
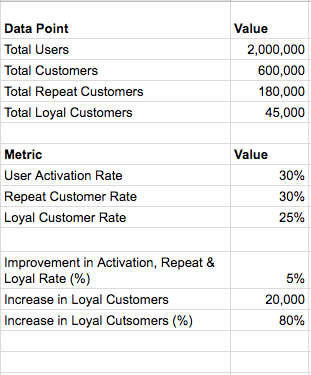
Pic 11: Impact of 5% improvement across all three Key CLM metrics
Not only the % of people in each lifecycle stage looks quite better, the increase in loyal customers by 80% is fantastic
With these three broad CLM goals defined and projections explored, we have a task cut out for the marketing/growth team to make plans around.
In this post we’ve focused on identifying the Key CLM Metrics and Defining CLM Goals. In the next post in this series we’ll discuss some strategies to achieve these goals.
If this is the first post you are reading in this series, there’s a prequel to this post on introduction to Ecommerce Customer Lifecycle Management here
Thanks Navneet Singh and Saurabh Tuteja for their feedback